In a recently published article, titled “Warmest U.S. December in history caps a stormy, mostly-sizzling year,” Yale Climate Connections (YCC) says all of the weather events of the past year are proof of dangerous climate change. They mention the word climate no less than 17 times in the article while at the same time listing dozens of weather events in an attempt to associate weather as being climate-driven. Conflating weather events with climate change is scientifically invalid. Even the Intergovernmental Panel on Climate Change (IPCC) knows that weather is not directly attributable to the climate conditions of any given year and says so in their most recent report.
This fact doesn’t stop YCC from trying to drum up concern and fear in order to advance a climate agenda.
The most prominent issue YCC focuses on is the claim that December 2021 was the hottest ever on record, while that is true, it isn’t relevant to the climate change discussion.
YCC writes:
After a strikingly mild autumn, December 2021 was astonishingly warm over large areas, especially the Southern Plains and lower Mississippi Valley, where many locations had multiple days soar well above 70°F and even 80°F.
…
Preliminary data for December from NOAA showed a total of 6,321 daily record highs and 910 monthly record highs either broken or tied across the nation.
YCC leads the reader to believe that this is something dramatic and unprecedented, when it in fact is nothing more then a persistent weather pattern that is part of our larger La Nina weather pattern in the Pacific Ocean this year. In an article at Phys.org a senior meteorologist from the National Weather Service had this to say:
The jet stream — the river of air that moves weather from west to east on a rollercoaster-like path—has just been stuck. That means low pressure on one part of the stream is bringing rain to the Pacific Northwest, while high pressure hovering over about two-thirds of the nation produces dry and warmer weather, said Brian Hurley, a senior meteorologist at the weather service’s Weather Prediction Center in College Park, Maryland.
If the jet stream moves more or bends differently, rain and other extreme weather won’t be as concentrated, Hurley said.
This is a typical weather pattern with a natural La Nina weather oscillation, he said. The flip side of El Nino, a La Nina is a cooling of parts of the central Pacific Ocean that changes weather patterns across the globe. La Ninas tend to bring more rain to the Pacific Northwest and make the South drier and warmer.
A graphic (Figure 1) from ABC News 8 in Richmond, VA illustrates how this shapes up across the nation:
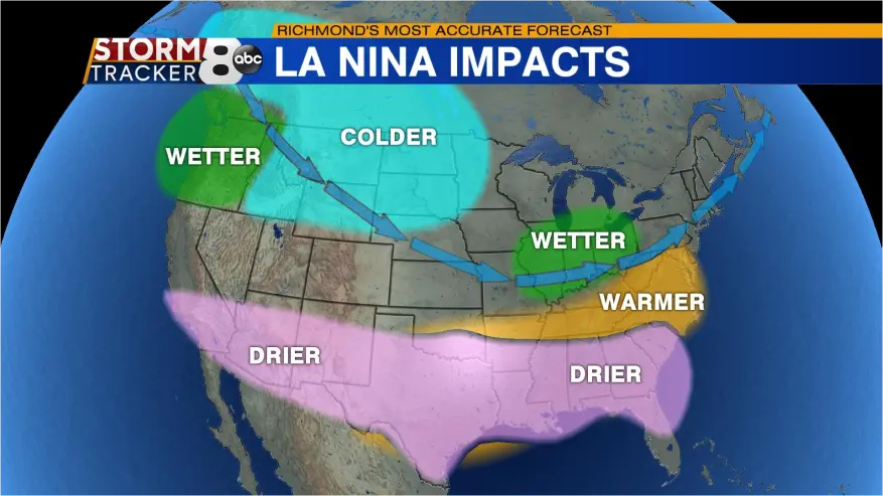
So, in a nutshell, we’ve experienced the usual and expected effects of this pattern. The eastern side of the United States got very warm weather, which just like in spring and summer creates thunderstorms and tornadoes.
But YCC paints this as unprecedented and catastrophic.
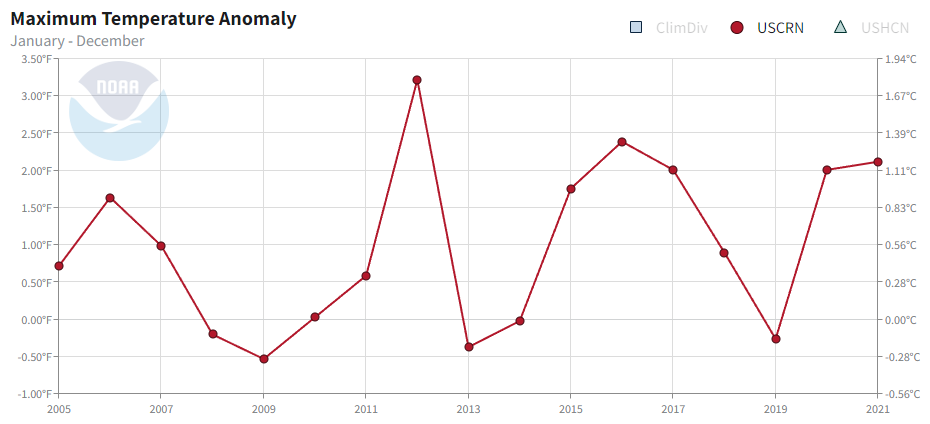
Let’s look at the national maximum temperature data for December for the U.S. Climate Reference Network, the most accurate and state of the art measurement system in the world, as seen in Figure 2.
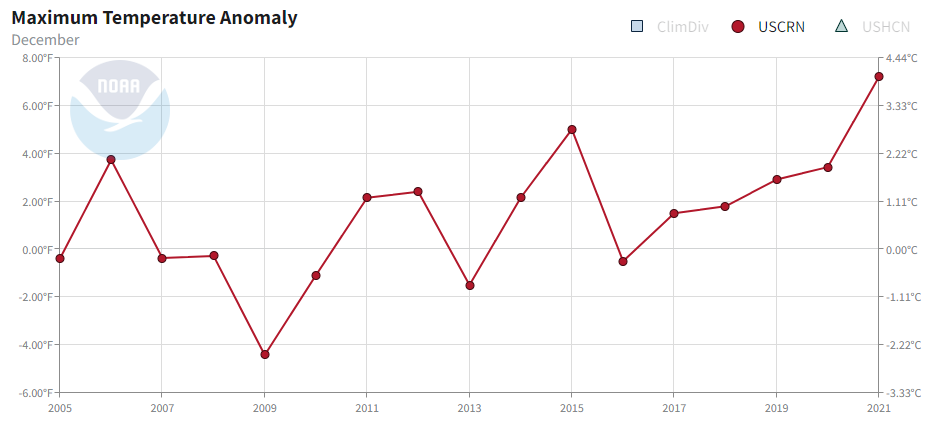
Figure2: December Maximum Temperatures in the Contiguous United States. Source: National Climate Data Center https://www.ncdc.noaa.gov/temp-and-precip/national-temperature-index/time-series/anom-tmax/1/12
The data confirm it was in fact the warmest U.S. December on record when looking at maximum temperatures, but that isn’t relevant to the climate debate. A month of warm temperature isn’t indicative of climate change. Since the article in YCC is about the year 2021, and its supposedly unprecedented set of climate-driven weather events, lets look at the year of maximum temperatures compare to other years.
Note that in Figure 3 below, 2021 isn’t special at all compared to other years.
But here is where it gets really interesting. If we look at ALL of the data available, going back to 1895, using another data set called Climate Divisions, the year 2021 isn’t the top year for the “record warmth” claims. See Figure 4 below.
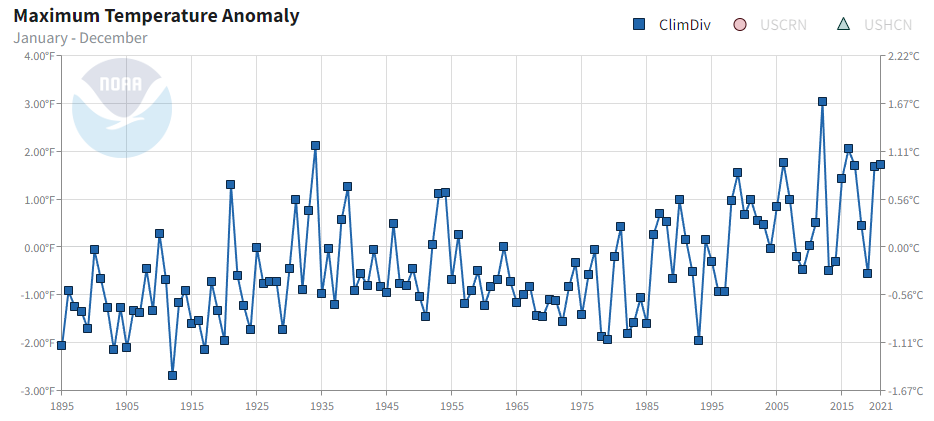
According to data provided by NOAA, 2021 had an anomaly of 1.73°F above normal, but that is far below 2016 at 2.05°F, 2012 at 3.04°F, and 1934 at 2.12°F. Looking at all the data, 2021 was not an exceptionaly warm year whatsoever.
Climate alarmists like to make claims of “worst ever” when it comes to temperature, and then try to use that to bolster arguments that the weather is getting worse due to climate change. Typically, though, they don’t tell the entire story, just the bits that would lend support to other false or misleading claims they make.
As illustrated by the YCC piece, the authors use virtually any weather event, hot or cold, below normal, above normal, wet, dry, or just even supposedly unique as “proof” that the climate is changing for the worse and humans are the cause.
There will always be weather disasters, but how we deal with them is what really defines how we move forward.
As I wrote in the Climate Realism article, Cambridge University is Explicitly Pushing for Political Authoritarianism in the Name of Climate Change,
Dr. Bjorn Lomborg has been tracking climate-related disasters from the database since 1920. This includes floods, droughts, storms, wildfires, and extreme temperatures. His conclusion from the data is clear and simple: fewer and fewer people are dying today from supposedly climate-related natural disasters.
As seen in the figure, the trend is clear.
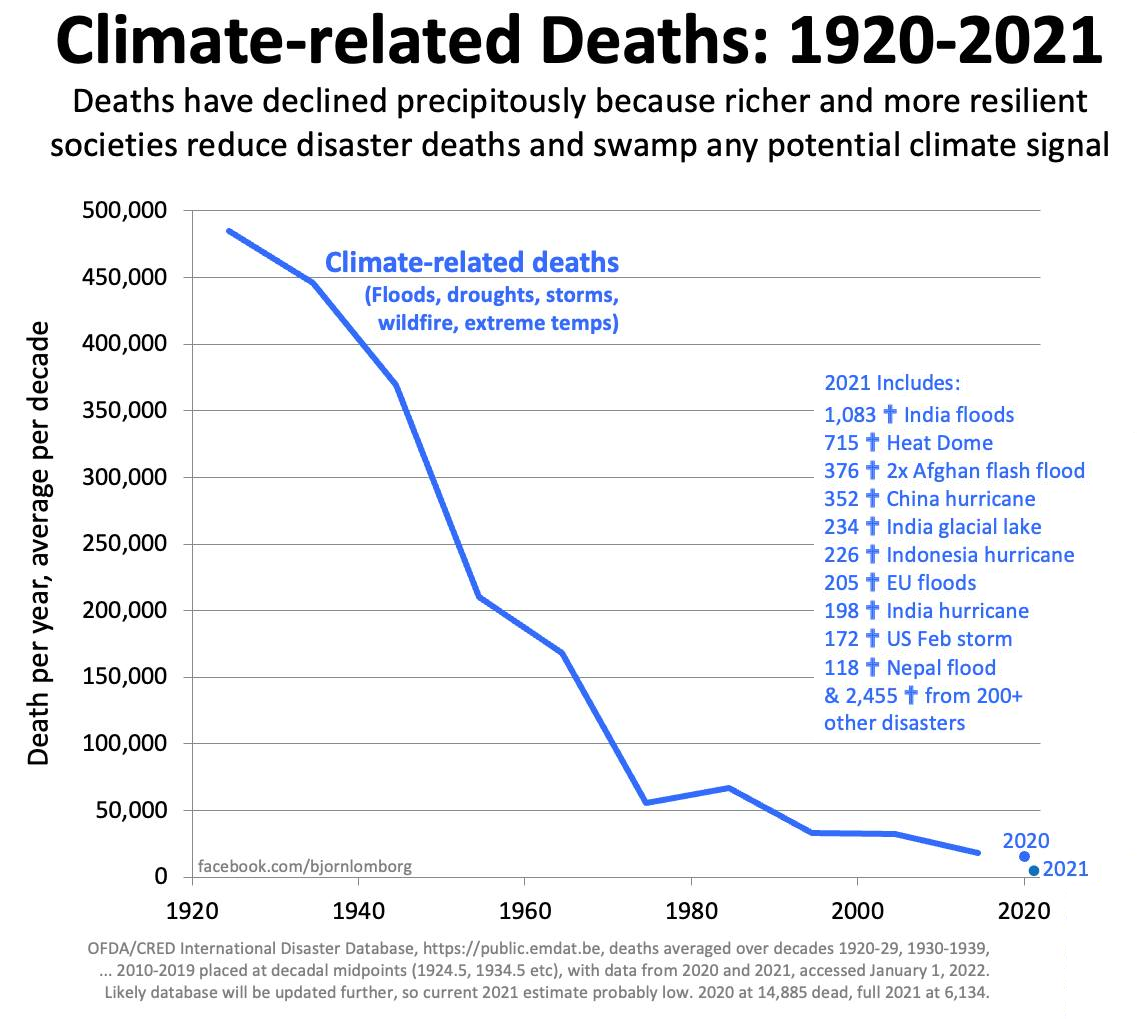
Lomborg writes:
Over the past hundred years, annual climate-related deaths have declined by more than 96%. In the 1920s, the death count from climate-related disasters was 485,000 on average every year. In the last full decade, 2010-2019, the average was 18,362 dead per year, or 96.2% lower.
This is even true of 2021 — despite breathless climate reporting, almost 99% fewer people died that year than a hundred years ago.
Yes, there was a lot of interesting weather in 2021, as there is interesting weather every year and will continue to be in the years ahead. Humanity’s response to weather extremes improves every year. There’s no indication that this will change or that “climate change” is worsening the human condition.