A May 16, 2023 article by CNN reporter Rachel Ramirez titled, “More than a third of the area charred by wildfires in Western North America can be traced back to fossil fuels, scientists find” claims that fossil fuel companies are directly responsible for a third of wildfires in the western U.S. and Canada. This claim is easily disproven by real-world data. Data show no correlation between wildfire acreage burned and CO2 produced from the burning of fossil fuel products.
The CNN article references a questionable study from the Union of Concerned Scientists (UCS) – a politically oriented climate activist organization who by their own admission, say “We use science to make change happen.” For the UCS science is not a tool to produce knowledge, but rather a lever political change.
Unfortunately, CNN was unable to discern this difference and treated the UCS press release as if it was actual science, rather than politically motivated climate activism disguised as science.
Reporting from the press release, CNN wrote:
The study by the Union of Concerned Scientists, published in the journal Environmental Research Letters, found that 37% of the area burned by wildfires in the West since 1986 — nearly 19.8 million acres out of 53 million — can be blamed on the planet-cooking pollution from 88 of the world’s major fossil fuel producers and cement manufacturers, the latter of which have been shown to produce around 7% of all carbon dioxide emissions.
The amalgam of megadrought and record-breaking heat that’s drying out vegetation due to climate change has stoked the West’s wildfires. And researchers found that since 1901, the fossil fuel activities of these companies, including ExxonMobil and BP, among others, warmed the planet by 0.5 degrees Celsius — nearly half of the global increase during that period.
The UCS “study” used a novel and little-known approach to link the so-called megadrought and heat to fossil fuel emissions: Vapor Pressure Deficit (VPD). The VPD is similar to, but not the same as, the more commonly known relative humidity seen in daily weather reports. In layman’s terms, VPD measures how much water is in the air versus the maximum amount of water vapor that can exist in that air. This atmospheric metric is hardly ever used.
In the study published by UCS, the authors claim::
Increases in burned forest area across the western United States and southwestern Canada over the last several decades have been partially driven by a rise in vapor pressure deficit (VPD), a measure of the atmosphere’s drying power that is significantly influenced by human-caused climate change.
…
We use a global energy balance carbon-cycle model, a suite of climate models, and a burned area (BA) model to determine the contribution of emissions traced to the major carbon producers to the long-term increase in VPD during 1901–2021 and to cumulative forest fire area during 1986–2021 in the western US and southwestern Canada.
In other words, rather than using real-world measured data, they used computer climate models to make an estimate based on assumptions about changes in vapor pressure deficits, which haven’t been actually measured, as such, across the time period claimed. As Climate Realism has repeatedly shown, model outputs are not the same as reality, and much-hyped climate models have been proven to run hot, projecting rising temperatures that are, in the words of the scientists who work on the models, “implausibly fast.” The UCS paper claims that VPD in the western U.S. and Canada is showing a long-term drying, thus contributing to wildfires. This drying via the VPD metric would be an indicator of increased drought conditions, yet no causation or even correlation has been shown between recent climate changes and wildfires.
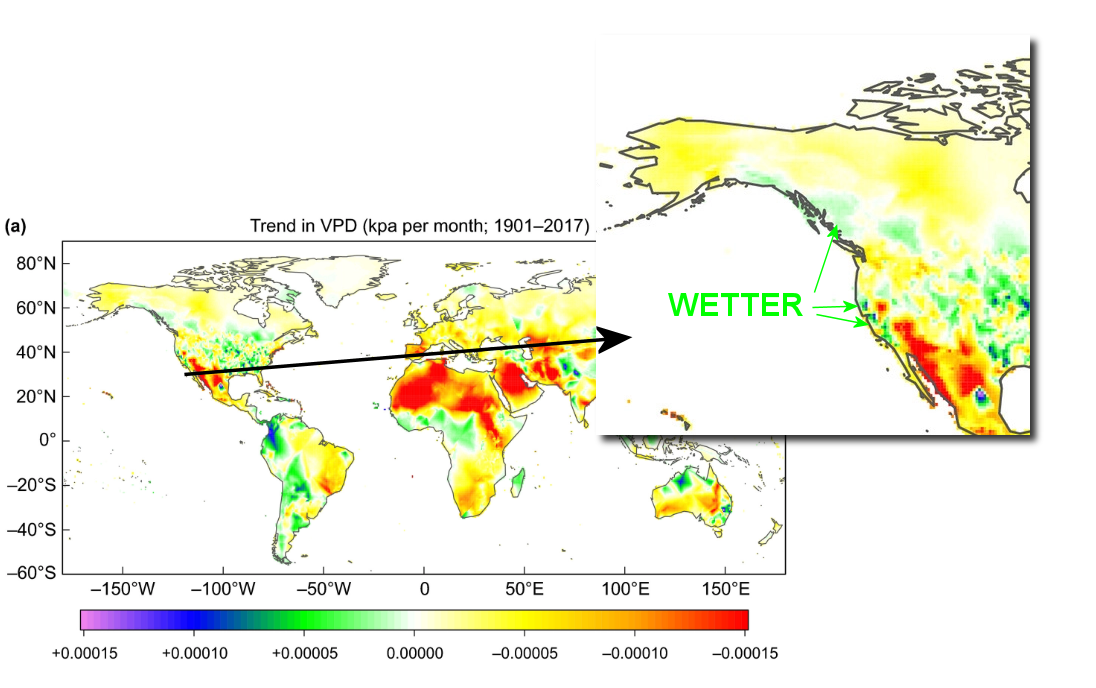
Most egregious of all, the UCS study itself ignored actual data in a paper they used as a reference to bolster their claim about VPD drying. In the 2020 paper Plant responses to rising vapor pressure deficit, actual VPD data was shown for the western U.S. and Canada. Surprisingly, these areas actually show VPD values that indicate more moisture, rather than less, completely contradicting the claims of drying made in the UCS study. This is seen in Figure 1 below, with both the U.S. and an expanded magnified panel showing the western area of the UCS study. The green colors indicate wetter conditions.
Not only are the authors of the UCS study ignoring the contradictory VPD evidence contained in the paper they are citing, they also selectively cherry picked the wildfire data, only citing the range of years which seemingly support their assertion that climate change induced VPD deficits are driving wildfires. UCS claims:
This analysis by the Union of Concerned Scientists (UCS) attributes portions of the observed increases in fire-danger conditions and burned forest area across the western United States and southwestern Canada (referred to here as western North America) to the world’s 88 largest fossil fuel companies…
…
The analysis finds that 37 percent of the cumulative burned forest area in western North America since 1986 can be traced to carbon emissions from these companies’ products.
Wildfire data from the National Interagency Fire Center (NIFC) was used in the UCS study. This data goes back to 1926. But even though UCS used VPD data back to 1901, they only used wildfire data from 1986 to the present. As you can see in Figure 2, in the early years of the data, wildfire in the US was much more prevalent. By using only more recent data, they UCS implies wildfires are increasing in relation to VPD.
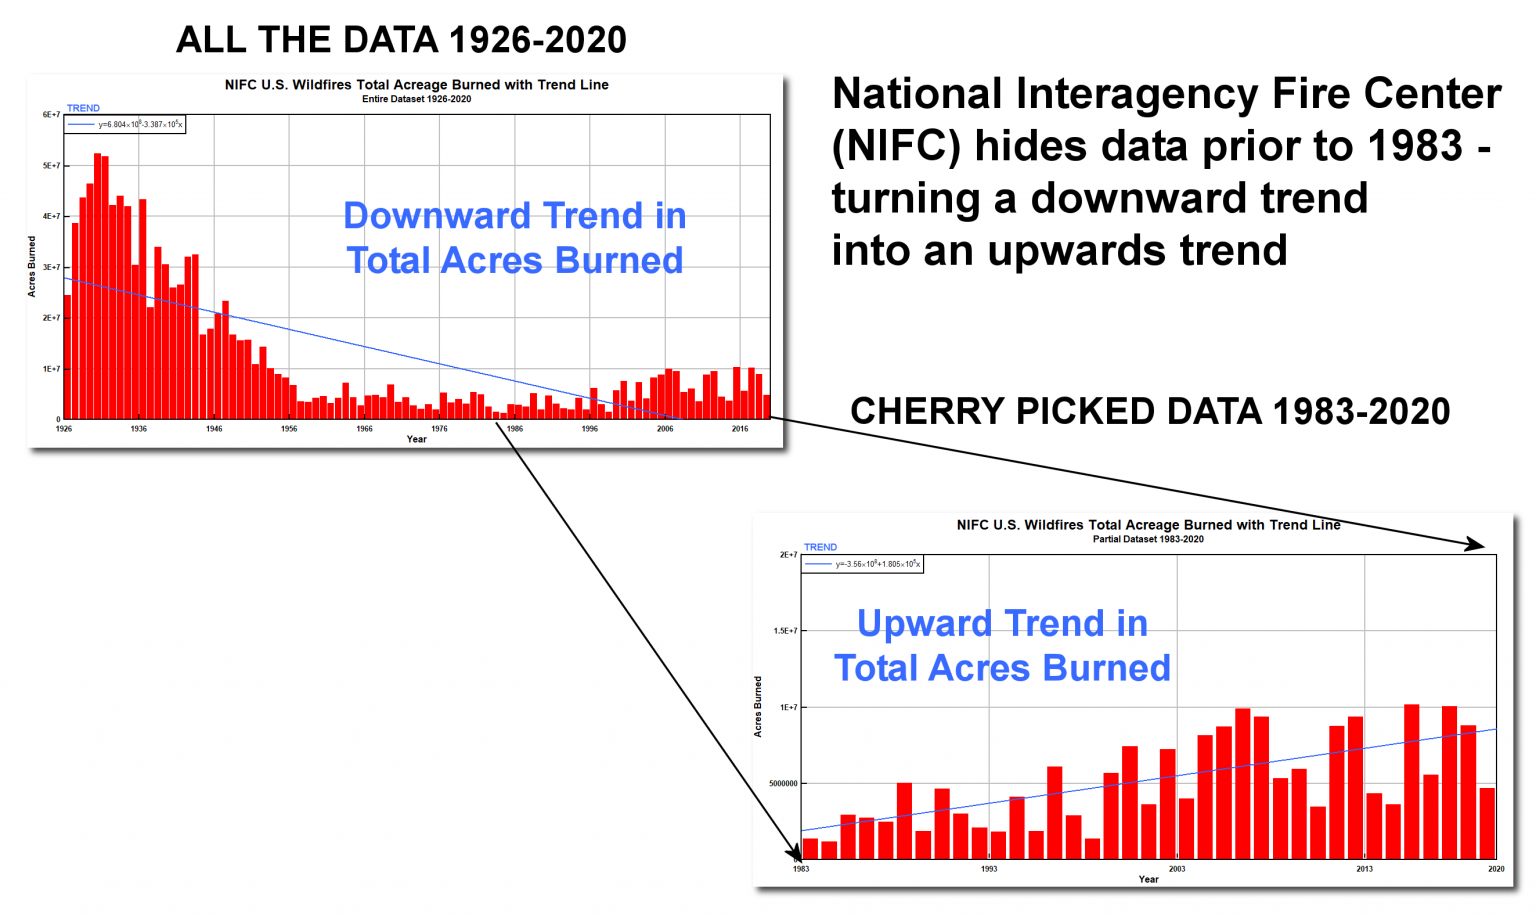
Climate Realism covered the blatant disappearance of earlier wildfire data here, noting that it was only disappeared after researchers began to cite it as showing wildfires are not getting worse in the United States. The data was valid enough to be used in the 2001 Update to 1995 Federal Wildland Management Policy. (PDF)
Using the entire NIFC dataset easily disproves the UCS “study”, but even more telling is the fact that when you compare carbon dioxide (CO2) levels between the cherry picked and full NIFC data, the lie by omission becomes clearly evident as seen in Figure 3.
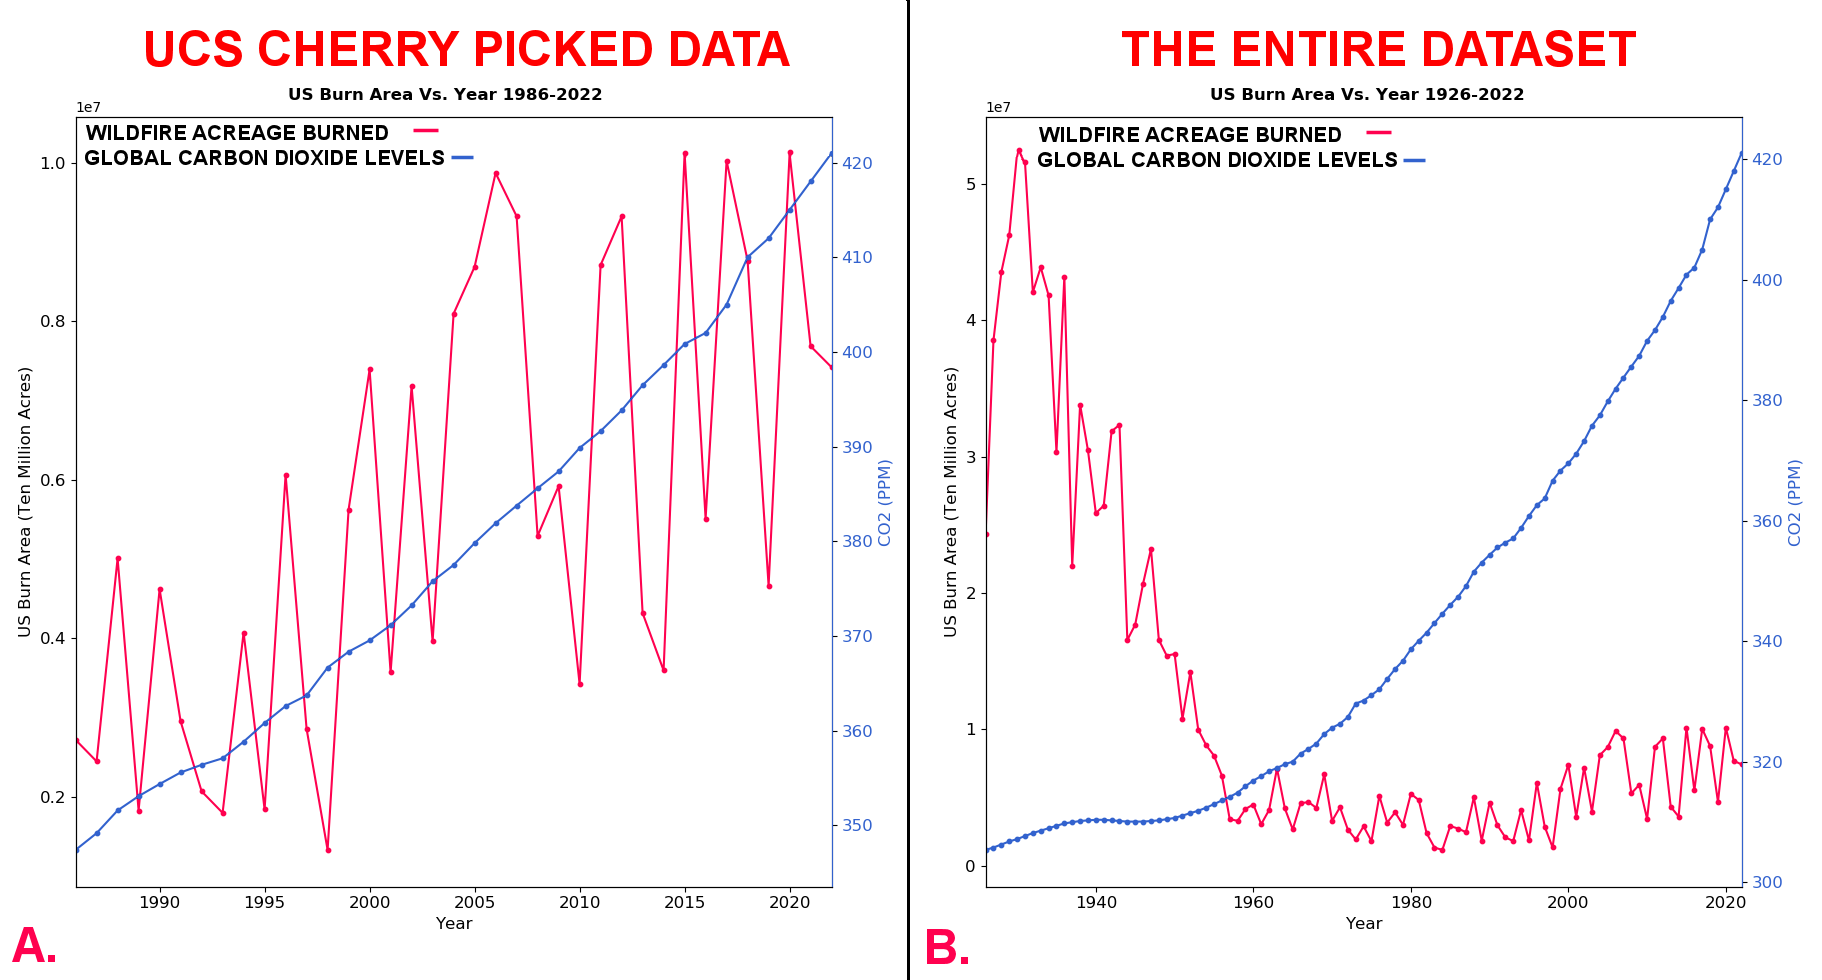
By hiding the data prior to 1986, UCS created the appearance of a false correlation between CO2 emissions and wildfire when none exists in the full data set. In other words, they lied by choosing only the data they wanted to show.
Finally, if that isn’t enough, recent satellite data shows no correlation between wildfire acreage burned and carbon dioxide levels. In fact, while carbon dioxide levels rose, wildfire area burned actually declined from 2000 to 2018. Further, according to a U.S. Forest Service report, fire-scarred California giant Sequoia trees indicate that severe fires occurred there in the years 245, 1441, 1580 and 1797 – well before climate change concerns and fossil-fuel companies ever existed.
As CNN is wont to do, it failed fact check any of the UCS’s claims with reference to available data. Instead, CNN simply regurgitated the claims from a political organization producing “science to make change happen.”
Any doubt that UCS is anything more than a “science for hire” organization is easily dispelled by that fact that my dog, Kenji, became a member of UCS simply by paying a fee. All that is required to become a “concerned scientist” is to provide a valid credit card.
Clearly, the UCS and CNN have gone to the dogs when it comes to scientific integrity and reporting science accurately to the public. Their so-called science doesn’t even pass the “sniff test.”