Originally published on WattsUpWithThat.
Mainstream media outlets often use graphics to show how temperatures are rising dramatically in recent decades, here, here, and here for example. Their claims are misleading, at best, because the graphs show statistical amplifications of data that is not part of the human real-world experience.
One of the most frightening aspects of global warming, aka “climate change” is the graphs produced from temperature data for public consumption and trumpeted by an unquestioning and compliant media. When it comes to measuring climate, in order to actually see any temperature differences over the last century, they must be highly magnified using the temperature anomaly method.
The most often cited global temperature anomaly graph is from the NASA Goddard Institute of Space Studies (GISS), showing yearly average temperatures since 1880, as seen in Figure 1 below.

To the untrained and uninitiated (i.e. the general public) it looks like Earth’s temperature is on a trajectory for a hot and terrible future.
Sometimes, media outlets such as the daily-doom newspaper known as The Guardian, will take that data and make their own graphs, making them look even steeper and scarier, such their highly statistically amplified graph from their 2019 article as seen in Figure 2.

Written by the ever-alarmed and always unreliable Damian Carrington, it is no wonder some children think they have no future due to “climate change”.
But in the real-world, people don’t experience climate as yearly or monthly temperature anomalies, they experience weather on a day to day basis, where one day may be abnormally warm, and another might be abnormally cold. Sometimes new records are set on such days. This is normal, but such records are often portrayed by the media as being evidence of “climate change” when if fact it is nothing more than natural variations of Earth’s atmosphere and weather systems. In fact, is doubtful humans would even notice the mild warming we’ve had in the last century at all, given that the human body often can’t tell the difference between 57°F and 58°F in any given moment, much less over a long term.
Essentially, what we know as climate change is nothing more than a man-made statistical construct. You can’t go outside and hold an instrument in the air and say “I’m measuring the climate.” Climate is always about averages of temperature over time. It’s a spreadsheet of data where daily high and low temperatures are turned into monthly averages, and monthly averages are turned into yearly averages, and yearly averages are turned into graphs spanning a century.
But, such graphs used in press releases to the media and broadcast to the public don’t really tell the story of the data honestly. They omit a huge amount of background information, such as the fact that in the last 40 years, we’ve had a series of El Niño weather events that have warmed the Earth; for example, 1983, 1998 and in 2016. The two biggest El Niño events are shown coinciding with temperature increases in Figure 3.

These graphs also don’t tell you the fact that much of the global surface temperature measurements are highly polluted with Urban Heat Island (UHI) and local heat-sink related siting effects that bias temperatures upward, such as the wholesale corruption of climate monitoring stations I documented in 2022, where 96% of the stations surveyed don’t even meet published standards for accurate climate observations. In essence – garbage in, garbage out.
But, all that aside, the main issue is how the data is portrayed in the media, such as The Guardian example shown in Figure 2.
To that end, I have prepared a new regular feature on WUWT, that will be on the right sidebar, combined with the long-running monthly temperature graphs from the state of the art (not polluted or corrupted) NOAA operated U. S. Climate Reference Network and the University of Alabama Huntsville (UAH) satellite derived temperature global record.

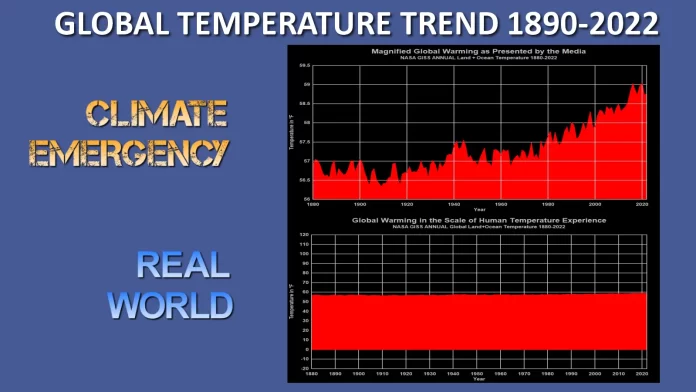
I’m utilizing the NASA Goddard Institute of Space Studies GISTEMP global dataset. The difference is simply this – I show both the absolute (measured) and the anomaly (statistically magnified) versions of the global temperature. This is accomplished by doing the reverse procedure as outlined in UCAR’s How to Measure Global Average Temperature in Five Easy Steps.
In this calculation, the “normal” temperature of the Earth is assumed to be 57.2°F. and that is simply added to the anomaly temperature reported by NASA GISS to obtain the absolute temperature. The basis of this number comes from NASA GISS itself, from their FAQ page as seen in August 2016 as captured by the Wayback Machine.

Of course GISS removed it from that page as seen today, because they don’t want people doing exactly what I’m doing now – providing the absolute temperature data, in a non-scary graphical presentation, done in the scale of how humans experience Earth’s temperature where they live. For that I’ve chosen a temperature range of -20°F to +120°F, which is representative of winter low temperature near the Arctic Circle and high summer temperature in many populated deserts, such as in the Middle East.


Can you tell which graph visually represents a “climate crisis” and which one doesn’t?
Feel free to check my work – the Excel spreadsheet and the calculations are here: GISSTEMP-in-absolute-master Download
To create the graphs above in Figures 5 and 6, I used the data from the Excel Sheet imported into the graphing program DPlot.


