


The media, politicians, and climate activists like to claim that climate change is making wildfires more frequent and larger. The linkage is the supposed relationship with increasing global atmospheric carbon dioxide (CO2) concentration due to the burning of fossil fuels and the belief that we will suffer increased effects; hotter temperatures, more drought, and increased wildfires as a result of those two elements increasing.
Here are some examples of the media pushing this:
Climate change is causing more wildfires and governments are unprepared, says U.N. (PBS)
As climate changes, world grapples with a wildfire crisis (UNEP)
Climate Scientists Warn of a ‘Global Wildfire Crisis’ (NYT)
In the New York Times article, the subtitle reveals the supposed cause:
“Worsening heat and dryness could lead to a 50 percent rise in off-the-charts fires, according to a United Nations report.”
Of course, the United Nations doesn’t do science, they do policy and politics, so take their claims with a grain of salt.
Fortunately, a look at real-world data can easily destroy such politically based claims. The European Space Agency (ESA) maintains a database of wildfire area burned, which is created from Earth observing satellite data. Last year the ESA announced an update to the dataset to bring it back to 1982:
Multi-Decade Global Fire Dataset Set To Support Trend Analysis
“The CCI fire team have extended the burned area record back to 1982”
And here is the fun part, when you use ESA satellite data to actually do trend analysis as they suggest, there’s a surprise; there isn’t any.
Statistician Zoe Phin recently used that ESA satellite data to do a trend analysis, and had this to say:
In a previous post, Trend in Global Fires, I showed the global fire trend in the last 21 years. I found a source with more data, extending to 1982. It comes from a project funded by European Space Agency. Right here. Actual data is downloaded from UK servers, here.
Phin created this graph (Figure 1) from that ESA satellite data:
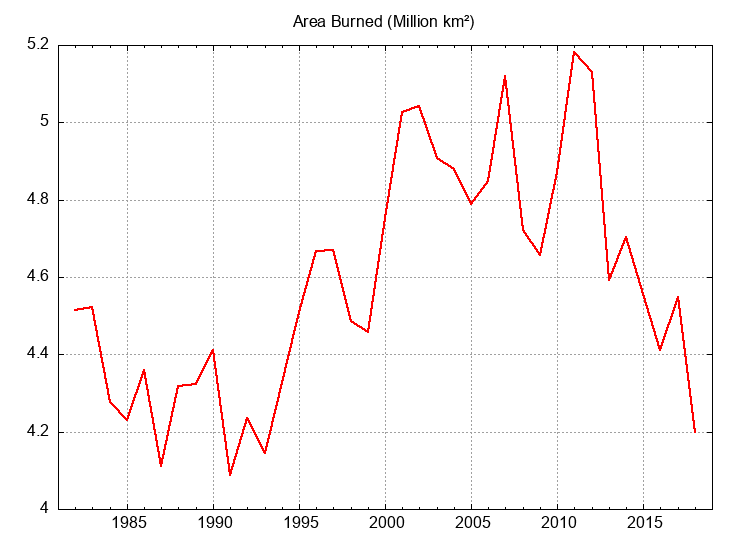
Phin added a statement of the obvious, at least to trained eyes:
“1994 is missing in their data, but that’s alright. It’s obvious that carbon dioxide has zero effect on fires. Anyone who tells you otherwise is a liar, an imbecile, or just plain ignorant. The latter can be cured.”
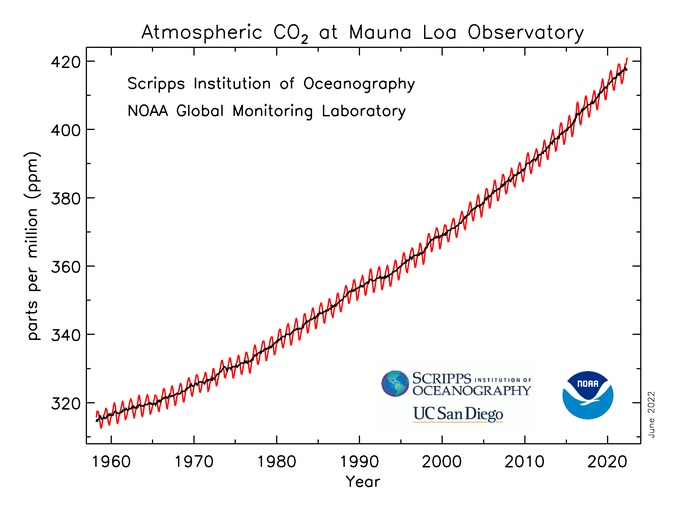
While many people who have follow the climate debate would be able to see the lack of correlation, it is important to visualize data from different sources on the same graph so there is no question on the interpretations. Below are two graphs, Figure 2 from the National Oceanic and Atmospheric Administration (NOAA) Global Monitoring Laboratory/Earth System Research Laboratories website where they show Trends in CO2:
And in Figure 3 below, this represents graphically combined Figure 1 and Figure 2 to create a new graph, Figure 3, which is set to match x and y scales, as well as the time scale of available ESA satellite data from 1982 to 2018. Unfortunately, ESA has not provided data beyond 2018.
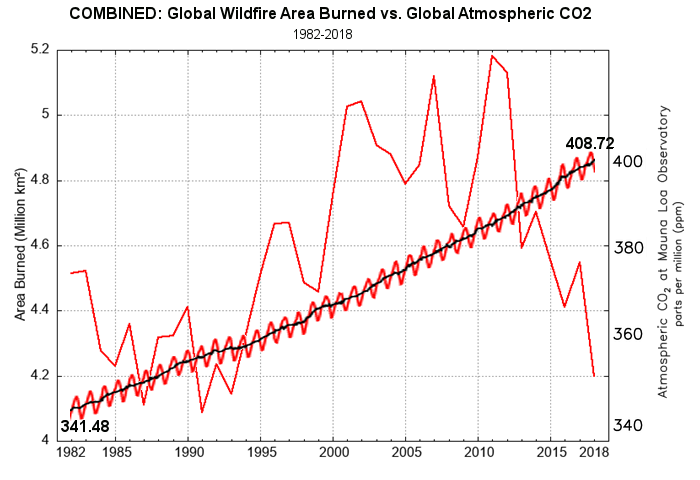
Clearly, there is no correlation whatsoever between increasing atmospheric CO2 and global wildfire acreage burned. From 1982 to 1993 while CO2 increased, fewer wildfires occurred. Then from 1993 to 2012, wildfires increased as CO2 increased. From 2012 to 2018, while CO2 increased relentlessly, there was a dramatic drop in global wildfire acreage burned, and the endpoint in 2018 is actually lower than when the data begins in 1982.
The lack of any sustained correlation destroys the U.N. and media claims. If CO2 was in fact the control knob for making wildfires worse, wildfires would have increased from 2012 to 2018 rather than dropping dramatically.
This data has no agenda, it simply tells the story. But media, politicians, and climate activists don’t like contrary data, because it ruins their narrative.


There is no logical connection between wildfire area burned and small changes in the global average temperature. I don’t understand how this myth continues. There could be a connection of acres burned and precipitation … but precipitation has had a rising trend with global warming.
Not declining.
I suppose anything bad that happens may get blamed on climate change because the media (except here) loves scaring people. For the past 25 years, I have observed government bureaucrats making climate claims that are not supported by their own government data. Not just wild guess predictions of doom — statements about current weather events and past weather and climate trends that are contradicted by their own data. This website does the best job of discovering the contradictions in the media, but they seem to be getting worse.
It is claimed that 90% of wildfires are man made. If the temperature increases slightly, there is no logical reason to believe humans will accidentally cause (or with arson) more acres to burn. In fact, the most warming would be at night when most people are sleeping (TMIN), so they wouldn’t even notice.
The acres burned depends on the number of fires, the amount of fuel (forest management), population living near or recreating in forests, precipitation, ability to spot fires quickly and the ability to extinguish fires.
In California, for one example, there is a dry “fire season”.
A few tenths of a degree warmer will not make the dry fuel in the forests any drier, because it is already dry (and ready to burn).
There are so many factors involved in the number of wildfires and acres burned that determining if tiny changes in the average temperature have any effect is impossible.
I read that Mr. Watts was affected by a forest fire a few years ago. A friend living in Santa Rosa got lucky — her own neighborhood was spared. California utilities ought to spend more dollars trimming trees around transmission lines instead of building solar panels. They do more tree trimming, and 10 feet from the wires too, here in Michigan where there is no dry fire season