Note: This simple graphic would be very useful to media outlets worldwide as a reality check for the accuracy of climate models. As we have said many times at Climate Realism, models run hot, and aren’t matching the data. Unfortunately, most media seems to approach models as factual, rather than fictional. -Editor
Guest essay by Christopher Monckton of Brenchley
A third of a century has passed since 1990, when IPCC made its first predictions of global warming. Over the 400 months since January 1990, IPCC’s original predictions of 0.2-0.5 C warming per decade over the following century (below) have proven grossly excessive.
In 1990, IPCC also predicted that at midrange doubling the CO2 in the air would cause 3 C global warming – the same warming as the predicted warming from a century of anthropogenic emissions from all sources. In 2021, IPCC predicted that warming by doubled CO2 would be 2 to 5 C, with a best estimate of 3 C, ten times the decadal predictions in 1990.
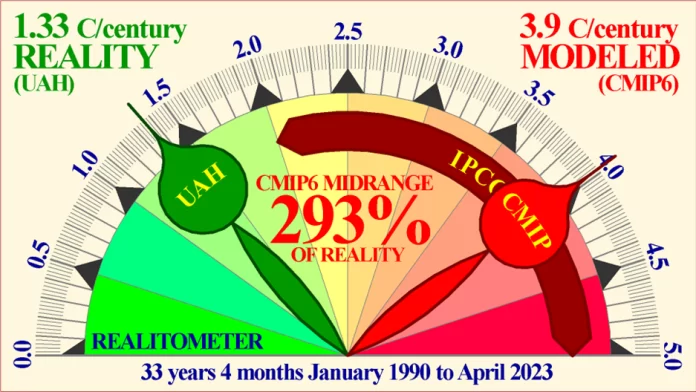
The Realitometer, which will be published each month, shows the real-world global warming per century equivalent since January 1990 from the satellite monthly temperature dataset of the University of Alabama in Huntsville, compared with IPCC’s range of predictions and with the midrange 3.9 C centennial-equivalent warming predicted in the CMIP6 models.
The Realitometer shows a mere 1.33 C/century equivalent real-world warming over a third of a century. The CMIP6 models’ midrange 3.9 C prediction is thus proving to be a shocking 293% overshoot compared with real-world warming. IPCC’s 2-5 C predictions are 150% to 375% of real-world warming. Yet since then IPCC has not reduced its predictions, first made in 1990, to bring them somewhere within range of observed reality.
IPCC based its predictions in 1990 on four emissions scenarios A-D. Scenario A was the “business-as-usual” scenario. It assumed substantial growth in annual emissions compared with 1990. Scenario B predicted no growth in annual emissions by now compared with 1990. In reality, annual emissions have grown by more than half since 1990. Emissions to 2021, the last full year for which figures are available, track the business-as-usual scenario A exactly. Yet the warming predicted under Scenario A is simply not occurring.
The Realitometer relies on satellite-measured temperature anomalies because the data are not contaminated, as the terrestrial datasets are, by the urban heat-island effect, the direct warming by emission of heat from cities, which is insufficiently corrected for.
UAH v.6 rather than other satellite datasets (RSS v.4, NOAA v.4 and Washington U v.1) is used because, as Andy May has pointed out in a distinguished column here, UAH alone has corrected the spurious data in the older NOAA-11 to NOAA-14 satellite instruments and because, after that correction, the UAH data conform far more closely than any of the other satellite datasets to the radiosonde data, an independent yardstick.
Month by inexorable month, the Realitometer will show just how absurdly exaggerated were and are the official predictions of global warming on which easily-manipulated governments – in Western nations only – have predicated their economy-destroying net-zero policies. Those policies are based on the notion that at midrange there will be almost three times as much global warming as has been occurring. Yet not one mainstream news medium has reported just how startlingly large the ratio of prediction to reality is proving to be.







Its disappointing that estimates in 2023 look so little different than the estimates from 1990. In 1990 I had not yet purchased a Motorola flip phone. In 1990 my desktop PC clicked and whirred as loud as a dump truck and suffered severe slowdowns trying to render offline Duke NukeEm mazes with sub-Minecraft graphic detail. In 1990… it just goes on and on. Starting with an assumption that the system took millions of years to arrive where it has arrived, what can be done to make can numbers behave frighteningly to passengers that expect to depart in decades?