Editors Note: This guest essay from meteorologist Chris Martz talks about how CNN uncritically reposted statements from embattled climatologist Michael Mann in an interview discussing summer a heat wave that has been forecast for the eastern half of the United States. The media has been promoting heat wave hysteria nearly continuously for the past two weeks. Mann made some wild claims about the heatwave that Martz completely debunks and falsifies simply by looking at past temperature records for cities highlighted by CNN. Mann, as a “distinguished professor” should have checked the data himself, but instead chose to turn a normal run-of-the-mill summer heatwave into a “climate crisis” without any actual evidence, and CNN posted it as fact, rather than the unjustified speculation that it is.
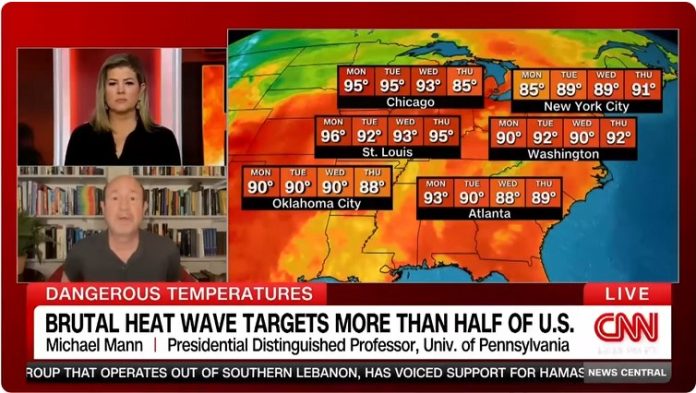
CNN’s Brianna Keilar interviewed their number one climate czar, Dr. Michael Mann from UPenn, yesterday, to discuss how this week’s “brutal” and “unprecedented” heatwave is being fueled by global warming and is a taste of our future.
“𝗧𝗵𝗶𝘀 𝗶𝘀 𝗮 𝗴𝗹𝗶𝗺𝗽𝘀𝗲 𝗼𝗳 𝗻𝗼𝘁 𝗼𝗻𝗹𝘆 𝘄𝗵𝗮𝘁 𝗼𝘂𝗿 𝗳𝘂𝘁𝘂𝗿𝗲 𝘄𝗶𝗹𝗹 𝗹𝗼𝗼𝗸 𝗹𝗶𝗸𝗲, 𝗯𝘂𝘁 𝗶𝗻 𝗳𝗮𝗰𝘁 𝗶𝘁 𝘄𝗶𝗹𝗹 𝗹𝗼𝗼𝗸 𝗾𝘂𝗶𝘁𝗲 𝗮 𝗯𝗶𝘁 𝘄𝗼𝗿𝘀𝗲 𝘁𝗵𝗮𝗻 𝘁𝗵𝗶𝘀. 𝗪𝗲 𝘄𝗶𝗹𝗹 𝘀𝗲𝗲 𝗺𝗼𝗿𝗲 𝘄𝗶𝗱𝗲𝘀𝗽𝗿𝗲𝗮𝗱 𝗮𝗻𝗱 𝗵𝗼𝘁𝘁𝗲𝗿 𝗮𝗻𝗱 𝗹𝗼𝗻𝗴𝗲𝗿-𝗹𝗮𝘀𝘁𝗶𝗻𝗴 𝗵𝗲𝗮𝘁𝘄𝗮𝘃𝗲𝘀 𝗶𝗻 𝘁𝗵𝗲 𝗳𝘂𝘁𝘂𝗿𝗲 𝗶𝗳 𝘄𝗲 𝗰𝗼𝗻𝘁𝗶𝗻𝘂𝗲 𝘁𝗼 𝗵𝗲𝗮𝘁 𝘂𝗽 𝘁𝗵𝗲 𝗽𝗹𝗮𝗻𝗲𝘁.”
Mann then goes off on an activist sales pitch, demonizing affordable and reliable energy consumption, which he himself benefits from:
“𝗔𝗻𝗱, 𝘀𝗼 𝗮𝗹𝗹 𝗼𝗳 𝘁𝗵𝗶𝘀 𝗴𝗲𝘁𝘀 𝘄𝗼𝗿𝘀𝗲 𝗶𝗳 𝘄𝗲 𝗰𝗼𝗻𝘁𝗶𝗻𝘂𝗲 𝗽𝘂𝗺𝗽𝗶𝗻𝗴 𝗰𝗮𝗿𝗯𝗼𝗻 𝗽𝗼𝗹𝗹𝘂𝘁𝗶𝗼𝗻 𝗶𝗻𝘁𝗼 𝘁𝗵𝗲 𝗮𝘁𝗺𝗼𝘀𝗽𝗵𝗲𝗿𝗲 𝗮𝗻𝗱 𝘄𝗮𝗿𝗺𝗶𝗻𝗴 𝘂𝗽 𝘁𝗵𝗲 𝗽𝗹𝗮𝗻𝗲𝘁. 𝗧𝗵𝗮𝘁’𝘀 𝘁𝗵𝗲 𝗯𝗮𝗱 𝗻𝗲𝘄𝘀. 𝗧𝗵𝗲 𝗴𝗼𝗼𝗱 𝗻𝗲𝘄𝘀 𝗶𝘀 𝘄𝗲 𝗰𝗮𝗻 𝘀𝘁𝗶𝗹𝗹 𝗱𝗼 𝘀𝗼𝗺𝗲𝘁𝗵𝗶𝗻𝗴 𝗮𝗯𝗼𝘂𝘁 𝗶𝘁; 𝘄𝗲 𝗵𝗮𝘃𝗲 𝘁𝗼 𝘀𝘁𝗼𝗽 𝗺𝗮𝗸𝗶𝗻𝗴 𝘁𝗵𝗲 𝗽𝗿𝗼𝗯𝗹𝗲𝗺 𝘄𝗼𝗿𝘀𝗲 𝗯𝘆 𝗴𝗲𝘁𝘁𝗶𝗻𝗴 𝗼𝗳𝗳 𝗳𝗼𝘀𝘀𝗶𝗹 𝗳𝘂𝗲𝗹𝘀.”
Someone should tell these people that this is what a glimpse of SUMMER looks like. There is nothing unprecedented or all that unusual about this heatwave. Not by summer standards nor by June standards.
Let’s look at the NWS forecast through Sunday for the same cities CNN plotted on their WSI graphic (seen above) at the 12-second mark in the video:
Atlanta, Georgia:
• Tue 6/18: 89° / record: 101° (1944)
• Wed 6/19: 89° / record: 99° (1933)
• Thu 6/20: 90° / record: 98° (1933)
• Fri 6/21: 93° / 98° (1933)
• Sat 6/22: 97° / 98° (1964 and 2022)
• Sun 6/23: 97° / 99° (1930 and 1944)
• Mon: 6/25: 95° / 99° (1930 and 1988)
Chicago, Illinois:
• Tue 6/18: 93° / record: 98° (1954)
• Wed 6/19: 95° / record: 102° (1953)
• Thu 6/20: 89° / record: 104° (1988)
• Fri 6/21: 92° / record: 101° (1988)
• Sat 6/22: 96° / record: 97° (1988)
• Sun 6/23: 86° / record: 97° (1930)
• Mon 6/24: 85° / record: 97° (1937 and 1953)
New York City, NY:
• Tue 6/18: 89° / record: 95° (1929)
• Wed 6/19: 91° / record: 98° (1994)
• Thu 6/20: 94° / record: 98° (1923)
• Fri 6/21: 94° / record: 97° (1953 and 1988)
• Sat 6/22: 88° / record: 98° (1988)
• Sun 6/23: 89° / record: 96° (1888)
• Mon 6/24: 87° / record: 96° (1888)
Oklahoma City, OK:
• Tue 6/18: 87° / record: 104° (2011)
• Wed 6/19: 89° / record: 101° (1918, 1953 and 2011)
• Thu 6/20: 86° / record: 104° (1918 and 1953)
• Fri 6/21: 91° / record: 104° (1936 and 1988) • Sat 6/22: 95° / record: 107° (1936) • Sun 6/23: 97° / record: 101° (1925, 1933 and 1934)
• Mon 6/24: 98° / record: 104° (1911)
St. Louis, MO:
• Tue 6/18: 91° / 101° (2021)
• Wed 6/19: 95° / 105° (1936)
• Thu 6/20: 96° / 103° (1953)
• Fri 6/21: 98° / 99° (1988) • Sat 6/22: 99° / 102° (1930)
• Sun 6/23: 94° / 101° (1930)
• Mon 6/24: 95° / 102° (1988)
Washington, D.C.:
• Tue 6/18: 92° / 97° (1944)
• Wed 6/19: 89° / 99° (1994)
• Thu 6/20: 92° / 99° (1931)
• Fri 6/21: 96° / 99° (2012)
• Sat 6/22: 97° / 101° (1988)
• Sun 6/23: 97° / 98° (1988)
• Mon 6/24: 93° / 100° (2010)
No daily records are in [the] forecast for any of those locations. This week’s heatwave does not compare to those of June 1936, 1944, 1953 or 1988.
Completely and totally ignorant of our weather history. Clowns.


