The media are hyping a new study claiming climate change has doubled the number of high-risk wildfire days in California. The claim depends on the assertion that autumn precipitation in California has “dropped 30% since 1980.” In reality, autumn precipitation in California has been rising by 0.02 inches per decade. Oops, time to cancel another fake climate crisis.
Activist scientists representing The Nature Conservancy and government-funded institutions wrote up the study, which should immediately invoke skepticism. The Nature Conservancy is a climate activist organization that raises more than $1 billion each year, much of it based on climate alarmism. Accordingly, Nature Conservancy studies are likely to be biased toward alarmist climate conclusions and should be examined closely.
The study claims, “decreases in autumn precipitation (~30%) over the past four decades have contributed to increases in aggregate fire weather indices (+20%).” The study defines the autumn season as September through November.
However, the National Oceanic and Atmospheric Administration (NOAA) keeps detailed records on California precipitation. Figure 1, below, is a NOAA chart showing historical California precipitation during September and October. NOAA reports a long-term increase of 0.02 inches of precipitation per decade.
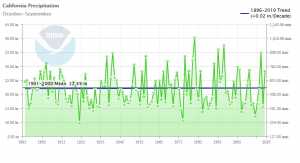
[Figure 1, above, shows California September-October precipitation has been increasing by 0.02 inches per decade. Source: National Oceanic and Atmospheric Administration (NOAA), https://www.ncdc.noaa.gov/cag/statewide/time-series/4/pcp/12/9/1895-2020?base_prd=true&begbaseyear=1901&endbaseyear=2000&trend=true&trend_base=10&begtrendyear=1895&endtrendyear=2020.]
Figure 2, below, is a NOAA chart showing historical California precipitation during October and November. NOAA reports shows a long-term increase of 0.01 inches of precipitation per decade.
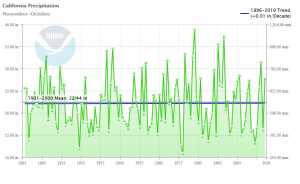
[Figure 2, above, shows California October-November precipitation has been increasing by 0.01 inches per decade. Source: National Oceanic and Atmospheric Administration (NOAA), https://www.ncdc.noaa.gov/cag/statewide/time-series/4/pcp/12/10/1895-2020?base_prd=true&begbaseyear=1901&endbas.]
So, how do the activist scientists claim autumn precipitation is declining? Easy. The charts above show that precipitation can vary quite a bit from year to year. The authors cherry-picked the beginning of their time period as a period of significantly above-average rainfall. Sure, if you start your analysis beginning with the unusual spike in rainfall around 1980 and pretend that such precipitation was typical, you can create a declining rainfall trend out of thin air. However, if you start your analysis in 1990, you have increasing rainfall. Or, better yet, looking at the entire record also shows increasing rainfall.
By the way, do you see those spikes in precipitation in the final year of each chart, in 2019? The authors conveniently cut off their data in 2018, even though data for the very wet autumn of 2019 is available. Go figure….
Curiously, the authors ignored the official NOAA data and instead used an unofficial dataset that appears to better suit their argument. Even their cherry-picked dataset, however, contradicts their claim. Does Figure 3, below, look like a 30% decline to you? Take a look at how consistently autumn rainfall has been increasing during the past 30 years. Only by cherry-picking an abnormally wet starting period can a declining trend be argued. And even with the cherry-picked start date, this sure doesn’t look like an ongoing crisis of declining precipitation.
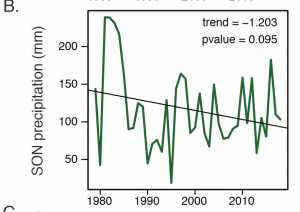
[Figure 3: This chart in the authors’ paper shows rainfall has been steadily increasing during the past 30 years, since 1990. Even starting their data during an abnormally wet period and not including the very wet autumn of 2019, the data do not support the claim of a 30% decrease in precipitation. Source: Environmental Research Letters, Accepted Manuscript, March 26, 2020 (Michael Goss et al 2020 Envir. Res. Lett. in press, https://iopscience.iop.org/article/10.1088/1748-9326/ab83a7)]
“This risk is definitely going to get worse before it gets better,” said study co-author Daniel Swain of The Nature Conservancy said in an April 3 Scientific American/E&E News article.
Yet, Swain’s own chart shows it has been getting better for the past 30 years, since 1990.
“It’s striking just how strong of an influence climate change has already had on extreme fire weather conditions throughout the state,” Swain added in an April 2 press release. “It represents yet another piece of evidence that climate change is already having a discernable influence on day-to-day life in California.”
Yeah, if you cherry-pick small pieces of data, misrepresent the small pieces of data that you cherry-pick, and then ignore the more complete dataset showing precipitation is increasing rather than decreasing by 30%, I guess you can find that “discernable influence.”