


The U.S. Environmental Protection Agency brought back its Climate Change Indicator’s platform last week. The platform claims various weather trends show, “Climate change is happening now … [causing] more extreme weather events.” This is false. Data from the U.N. Intergovernmental Panel on Climate Change (IPCC) and the U.S. National Oceanic and Atmospheric Administration (NOAA) show incidences of extreme weather events are neither more frequent nor more severe than in the past.
Among the indicators EPA says demonstrate human carbon dioxide emissions are causing dangerous climate change are increases in heatwaves in the 50 largest metropolitan areas in the United States, from 1961 through 2019. EPA writes:
- Heat waves are occurring more often than they used to in major cities across the United States. Their frequency has increased steadily, from an average of two heat waves per year during the 1960s to six per year during the 2010s.
- In recent years, the average heat wave in major U.S. urban areas has been about four days long. This is about a day longer than the average heat wave in the 1960s.
- Of the 50 metropolitan areas in this indicator, 46 experienced a statistically significant increase in heat wave frequency between the 1960s and 2010s.
The NOAA data EPA cites does show an increase in the number and length of heatwaves in America’s largest cities. That fact tells only part of the story, not the whole truth. EPA’s heatwave report misleads about the causes of the increasing number of hot days (actually nights) in major cities and for the United States as a whole.
Several facts EPA buries in the fine print indicate supposed human-caused global warming is not causing an increase in the number and intensity of heatwaves in the United States.
First, EPA cherry-picked the 1960s – during a period of global cooling – as the baseline for its heatwave comparisons. Nevertheless, heatwaves during recent decades remain far less frequent and severe than was the case during the 1930s. Indeed, a majority of each state’s all-time high temperature records were set during the first half of the 20th century. EPA grudgingly acknowledges this fact, admitting “Longer-term records show that heat waves in the 1930s remain the most severe in recorded U.S. history.” The agency devotes only a single bullet point to this fact amidst multiple pages of heatwave alarmism.
Second, EPA downplays the role expanding urbanization and intensive human development in and around cities has played in driving measured heat increases. Even the climate alarmist group the Union of Concerned Scientist (UCS) remarks on EPA’s heatwave sleight of hand in an article titled, “Four Things to Know—and a Word of Caution—about EPA’s Climate Change Indicators Website Reboot.”
“Human-caused climate change often intersects with other trends that affect climate locally or regionally, which often makes it tricky to answer the question. How much of what we’re seeing is due to human-caused climate change, and how much is due to other things?” writes the author of the UCS story. “Urban heat waves are a prime example.
The Union of Concerned Scientists article continues, “The data represent 50 urban areas across the United States—not the country as a whole. … What we’re likely seeing here is that urban areas have experienced a combination of rising temperatures, driven by human-caused climate change, and an increase in the urban heat island effect resulting from urban development. The page on EPA’s website that’s about this indicator includes information about the urban heat island effect, but it’s buried in the ‘About the Data’ section.”
In its “About the Data” section, EPA writes:
As cities develop, vegetation is often lost, and more surfaces are paved or covered with buildings. This type of development can lead to higher temperatures—part of an effect called an ‘urban heat island.’ Compared with surrounding rural areas, built-up areas have higher temperatures, especially at night. Urban growth since 1961 may have contributed to part of the increase in heat waves…. This indicator does not attempt to adjust for the effects of development in metropolitan areas …”
The fact that higher urban temperatures are reflected almost exclusively in higher nighttime lows, rather than higher daytime highs, demonstrates the urban heat island effect is the key factor to driving more heatwaves in cities.
EPA reports many of the temperature readings it referenced were at airports, which have grown considerably in size and traffic since the 1960s. The cities themselves have sprawled into surrounding countryside. Rural areas have become swallowed by asphalt, concreate, dark rooftops, and covered with multiple sources of artificial heat such as homes, businesses, and the heaters, air conditioners, traffic, and artificial sources of light associated with them. These surfaces absorb heat during the day, only to release it slowly at night, resulting in higher measured nighttime low temperatures.
The first-ever comprehensive review of the quality of data,coming from the National Weather Service’s (NWS) network of stations, examined more than 850 stations. It found that 89 percent of the stations, nearly nine of every 10, fail to meet NWS’s own siting requirements for trustworthy measurements.
As shown in the figure below, the most accurate nationwide temperature station network, the U.S. Climate Reference Network (USCRN), shows no increasing trend in high temperatures in the United States since it was established in 2005.
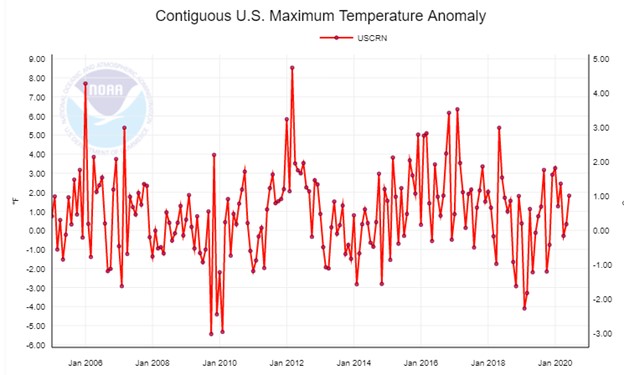
The USCRN was specifically assembled to counteract the recognized bias in NWS temperature measurements and trends resulting from increased urbanization.
As cities grow, they get hotter, especially at night. Contrary to EPA’s assertion, there is no evidence that the increase in heatwaves in America’s 50 largest cities is due to global warming. Instead, the data indicate it is an artifact of urban growth. This is a fact even climate alarmists like the UCS recognize.


Another brilliant expose by H. Sterling Burnett.
Where would this country be without Heartland. I shudder to think.