The headline in E&E News, WOWT-TV, Scientific American, WorldNewsNetwork, and other media outlets this week, “Unprecedented Heat Wave in Pacific Northwest Driven by Climate Change” couldn’t possibly be more unscientific. With absolutely no analysis, no historical context, and nothing but conjecture, author Anne. C. Mulkern eschewed science for advocacy in her reporting of the brief Pacific Northwest (PNW) heat wave this week.
Yes, the heat wave set all-time high temperature records in Washington, Oregon, and Canada. But consider this: At best, we have about 150 years of reliable weather records for the PNW, so a “black swan” outlier event like this isn’t surprising. It’s happened before, most certainly. We just weren’t around to observe it. After all, Native Americans did not keep written weather records.
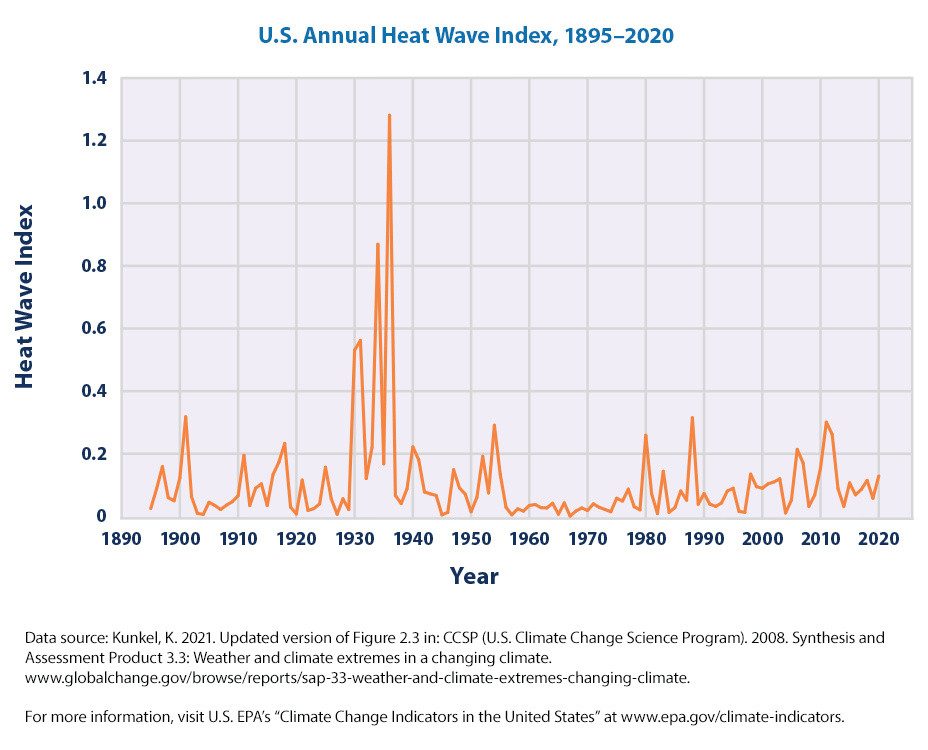
High (and low) temperature records are nothing new. But it is important to look at the past, because data show us that more high temperature records were set during the first half of the twentieth century than during the past 50 years. Even the Environmental Protection Agency (EPA) confirms this.
But many climate activists immediately pointed to “climate change” as the cause, even though this week would have become a record weather event with or without recent modest warming. It is said that “climate change,” aka global warming, added about 2 degrees Fahrenheit over the past century, but the temperature of the past week far exceeded that.
The temperatures were so high, the small warming of 2°F of climate change was dwarfed. In cities, the “urban heat island effect” was also a bigger cause in this case. Portland and Seattle hit all-time highs of 116 and 108 Monday, while Lytton, Canada surged to a national record of 118. The EPA reports,
“…the heat island effect results in daytime temperatures in urban areas about 1–7°F higher than temperatures in outlying areas.”
The previous all-time record high for Portland was 107. Seattle’s all-time high was 103. Medford, Oregon tied its all-time record Monday of 115 degrees. It didn’t get hotter there than ever before because Medford was south of the center of the high-pressure dome.
It is often said that “weather is not climate” and that’s true. It is particularly true in this case.
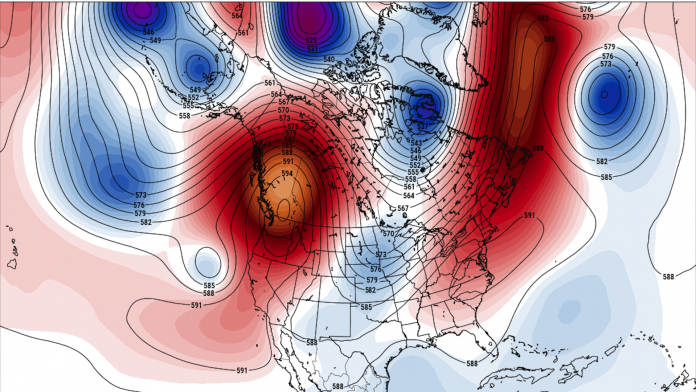
The heat wave was entirely a weather pattern issue, not a climate issue. A large high-pressure dome (sometimes called a heat-dome) over the PNW is not unheard of, but this one was particularly strong. In fact, it was a result of a perfect storm of weather pattern confluence. Similar unique weather pattern confluences happen each year to create major blizzards, torrential floods, and tornado outbreaks. It’s business as usual for Earth.
High pressure rotates clockwise, causes sinking air, and creates downslope winds (Foehn winds), which heat up because the air compresses as it flowed down the slope of the Cascade Mountains from east to west towards Portland and Seattle. It’s like the Santa Ana winds in Southern California. It’s the same effect as using a bicycle pump to fill a tire. The pump gets warm, not from friction, but because of the gas (air) is being compressed. Conversely, aerosol cans get colder, because gas under pressure is escaping and decompression occurs inside the can. This is described by science, known as the Adiabatic process.
Most interestingly, another record wasn’t trumpeted by the news media. With the heat-dome high pressure moving east, Seattle and Portland saw record rates of cooling. The National Weather Service office in Portland reported another new all-time record.
“Huge cooling Monday evening inland, with temperatures falling from above 100 deg to the 60s/70s. Portland set a new record, with a drop of 52 deg, breaking old record of 48 deg set in Sep 1988. Cooler today, with highs 85 to 93 inland, and 60s on the coast.”
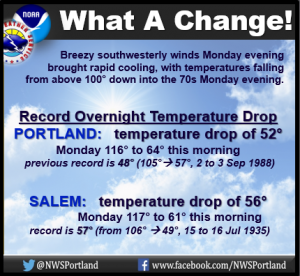
That all-time record cooling event didn’t get much press because it goes against the groupthink narrative that “climate change” causes only bad things. Plus, the news media is often fixated on disaster more than good news.
When record heat and record cooling both happen within a 24-hour period, that’s inarguably weather, not climate.
The National Oceanic and Atmospheric Administration (NOAA) defines it well:
“Weather reflects short-term conditions of the atmosphere while climate is the average daily weather for an extended period of time at a certain location. … Weather can change from minute-to-minute, hour-to-hour, day-to-day, and season-to-season.”
Finally, in a hugely ironic twist, Scientific American, the same outlet that claimed the heat wave was driven by “climate change” confirms what NOAA and I just told you, saying Don’t Be Fooled: Weather Is Not Climate.
You can’t have it both ways.
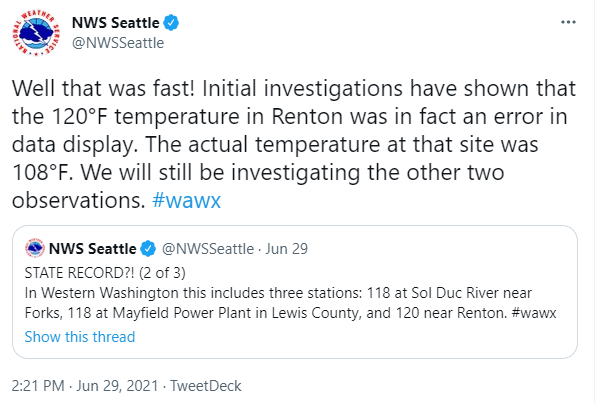
UPDATE: Some of the high temperature records have already proven to be erroneous according to the National Weather Service:









Thank you Anthony. Now we have to convince the idiots…..no small task going against their confirmation bias!
[…] Data from the Environmental Protection Agency agree. The EPA website features a 2016 chart labeled “the U.S. Heat Wave Index from 1895 to 2015,” and it reveals that the worst U.S. heat waves by far happened in the 1930s. […]
[…] Data from the Environmental Protection Agency agree. The EPA website features a 2016 chart labeled “the U.S. Heat Wave Index from 1895 to 2015,” and it reveals that the worst U.S. heat waves by far happened in the 1930s. […]
[…] Data from the Environmental Protection Agency agree. The EPA website features a 2016 chart labeled “the U.S. Heat Wave Index from 1895 to 2015,” and it reveals that the worst U.S. heat waves by far happened in the 1930s. […]
[…] Data from the Environmental Protection Agency agree. The EPA website features a 2016 chart labeled “the U.S. Heat Wave Index from 1895 to 2015,” and it reveals that the worst U.S. heat waves by far happened in the 1930s. […]
[…] 환경 보호국의 데이터가 동의합니다. EPA 웹사이트에는 “1895년부터 2015년까지의 미국 폭염 지수”라는 레이블이 붙은 2016년 차트가 있습니다. 미국 최악의 폭염 지금까지 일어난 1930년대. […]
[…] Data from the Environmental Protection Agency agree. The EPA web site contains a 2016 chart labeled “the U.S. Heat Wave Index from 1895 to 2015,” and it reveals that the worst U.S. warmth waves by far occurred within the Thirties. […]
[…] Data from the Environmental Protection Agency agree. The EPA website features a 2016 chart labeled “the U.S. Heat Wave Index from 1895 to 2015,” and it reveals that the worst U.S. heat waves by far happened in the 1930s. […]
[…] Data from the Environmental Protection Agency agree. The EPA website features a 2016 chart labeled “the U.S. Heat Wave Index from 1895 to 2015,” and it reveals that the worst U.S. heat waves by far happened in the 1930s. […]
[…] Data from the Environmental Protection Agency agree. The EPA’s website has a 2016 chart labeled “US Heatwave Index 1895 to 2015” and it reveals that worst heatwaves in the US so far happened in The 1930s. […]