Right: Carbon Capture and Storage is a Scam")


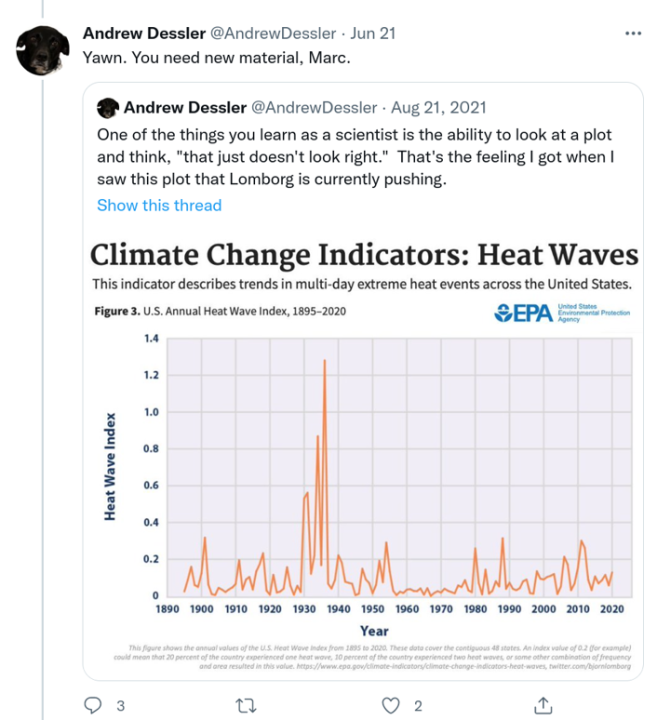
Atmospheric scientist Andrew Dessler of Texas A&M University created a stir online at Twitter last year when he decided that a graph published by the EPA, and cited by Bjorn Lomborg a year ago “just didn’t look right.”
Science doesn’t follow, “just didn’t look right” as a rule of discovery or investigation, and as a scientist, Dessler should know better. Following a personal viewpoint of “just doesn’t look right” is a fast track to confirmation bias. Here is what Dessler said:

But, like many climate alarmists, Dessler just has a hard time believing that any time in the past could be worse than the present when it comes to weather. There has been so much rhetoric about the age we live in as being “hottest ever” and “unprecedented” that some people actually begin to reject contrary data that has been around for years.
In this case, Dessler would have us believe that the “dust bowl” period in United States history is nothing compared to the ravages of heat waves and drought experienced in the United States today, and he set out to prove his beliefs with a series of Tweets which you can read here.
Recently, during a discussion with ClimateDepot’s Marc Marano, Dessler brought up the thread from last year again.
But what are the real facts about the 1930’s heat wave? Is it merely a statistical aberration or a “cherry pick” as Dessler suggests? Or is it real? And if it isn’t real, but “cherry picking” of data, as Dessler contends, why would the EPA publish it?
Research yields the following undisputable facts about the 1930’s heat waves, contradicting Dessler’s viewpoint. First, the World Meteorological Organization defines a heat wave as five or more consecutive days during which the daily maximum temperature surpasses the average maximum temperature by 5 °C (9 °F) or more.
1. Yes, extended heat and drought did actually occur through a majority of the United States during that period. The year 1936 was particularly bad. Wikipedia notes this:
July 1936, part of the “Dust Bowl,” produced one of the hottest summers on record across the country, especially across the Plains, Upper Midwest, and Great Lakes regions. Nationally, about 5,000 people died from the heat.
Source: https://en.wikipedia.org/wiki/1936_North_American_heat_wave
The U.S. National Weather Service says:
… the summer of 1936 featured the most widespread and destructive heat wave to occur in the Americas in centuries.
Source: https://www.weather.gov/ilx/july1936heat
2. The heat waves of 1934 and 1936 were caused by natural ocean patterns, according to this peer-reviewed paper from 2015 which said,
Two ocean hot spots have been found to be the potential drivers of the hottest summers on record for the Central US in 1934 and 1936. The research may also help modern forecasters predict particularly hot summers over the central United States many months out.
Source: Markus G. Donat, Andrew D. King, Jonathan T. Overpeck, Lisa V. Alexander, Imke Durre, David J. Karoly. Extraordinary heat during the 1930s US Dust Bowl and associated large-scale conditions. Climate Dynamics, 2015; DOI: 10.1007/s00382-015-2590-5
3. The Fourth U.S. National Climate Assessment (NCA) from 2017 did a detailed analysis of the United States heat waves, including cold and warm spells going back to 1900, and found the exact same thing the EPA did. Below is figure 6.4 from chapter 6. Note the very bottom panel.
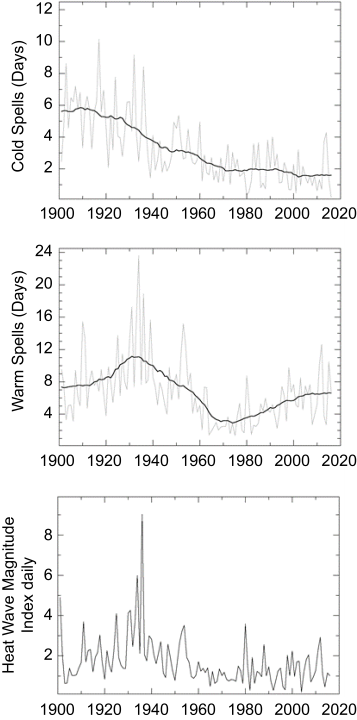
The NCA added this, bold mine.
Since the mid-1960s, there has been only a very slight increase in the warmest daily temperature of the year (amidst large interannual variability). Heat waves (6-day periods with a maximum temperature above the 90th percentile for 1961–1990) increased in frequency until the mid-1930s, became considerably less common through the mid-1960s, and increased in frequency again thereafter (Figure 6.4). As with warm daily temperatures, heat wave magnitude reached a maximum in the 1930s. The frequency of intense heat waves (4-day, 1-in-5 year events) has generally increased since the 1960s in most regions except the Midwest and the Great Plains. , Since the early 1980s (Figure 6.4), there is suggestive evidence of a slight increase in the intensity of heat waves nationwide as well as an increase in the concurrence of droughts and heat waves.
Source: https://science2017.globalchange.gov/chapter/6#fig-6-4
This 2017 NCA report clearly supports the EPA chart, and contradicts Dessler’s viewpoints of heat waves being worse in the present, and that the 1930’s heat wave spike was a result of some “cherry picking” of data.
4. An independent data analysis of heat wave events also contradicts Dessler.
The figure below is a result from 671 individual U.S. Historical Climatology Network (USHCN) stations with greater than 94 percent data availability. This is the number of days in “heat waves” lasting at least 5 days in length, in which each day is above the 95th percentile of the distribution of the daily values per date.
There were 671 stations which qualified for the 94 percent available data of the total 1218 USHCN stations.

Note that the Western United States (ID+OR+WA, CA+NV and AZ+CO+NM+UT) had their highest number of Heat Wave Days in the last decade, but the rest of the country was near/below the national average. Clearly there have been some regional changes in the last 110 years, suggesting weather pattern changes, but for the nation as a whole (gray bars), the decade of 1932-1941 still stands out as the warmest.
Interestingly, this is a very different result compared to Dessler’s claims, especially when it comes to some of the graphs he posted, such as this one in his Twitter thread:
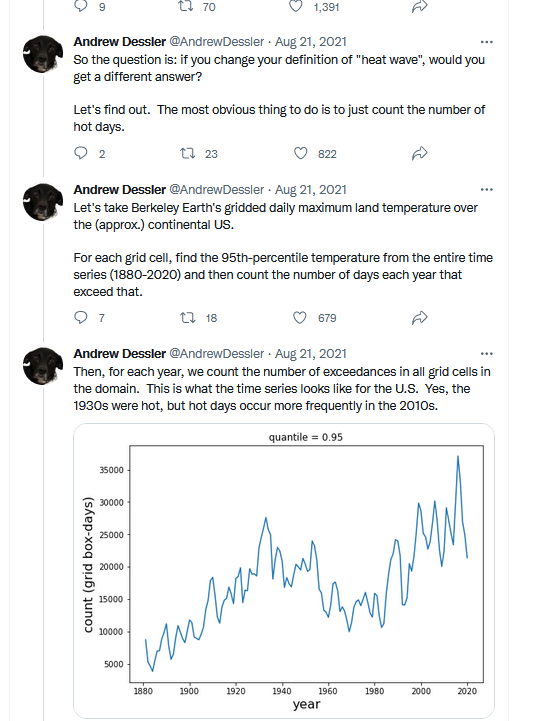
Dessler’s graph indicates the dataset he is using (Berkeley Earth) has had some temperature adjustments applied. The difference is not geographic as the result from the USHCN stations is weighted by area also. We can get Dessler’s result, more or less, if we add 1°F to each daily temperature from 1980 to 2005 and then 2°F more from there to the end of the data. This gives a rough estimate of the magnitude of the adjustments that have been applied to the dataset he used.
The bottom line: unless you use adjusted data, you can’t get to Dessler’s results.
If Dessler wants to claim that the hundreds of observers that made high temperature measurements over decades should have that hard-earned data adjusted, he can claim that, but he ends up with a result he claims to abhor, one that is “cherry picked” by using adjusted data rather than the actual high temperatures that were recorded through history. Adjusted high temperature data is not the same as actual measured high temperatures, it isn’t even real.
Imagine if your evening news weather report, when reporting high temperatures for your area that day, used adjusted high temperature data to present the results to viewers. The backlash would be swift and vicious.
You can compare all of the facts in points 1-4 above to Dessler’s “just didn’t look right” analysis and make your own judgments about when heat waves were worse in the United States. You can believe the real actual data measured at the time, or the data that has but put through a statistical adjustment mill decades later.