Guest essay by Paul Homewood
The British Boradcasting Corporation (BBC) recently published this claim:
Sea levels are rising much faster than a century ago, reveals the Met Office’s annual look at the UK’s climate and weather.
The State of the Climate report also says that higher temperatures are the new normal for Britain.
Conservationists warn that spring is coming earlier and that plant and animal life is not evolving quickly enough to adapt to climate change.
The report highlights again the ways climate change is affecting the UK.
The UK is warming slightly faster than the average pace of global temperature increase, it also explained.
The Met Office assessed climate and weather events for 2021 including extreme events like Storm Arwen that caused destructive flooding.
Sea levels have risen by around 16.5cm (6.5 ins) since 1900, but the Met Office says the rate of rise is increasing. They are now rising by 3-5.2mm a year, which is more than double the rate of increase in the early part of last century.
The Met Office has published its latest State of the UK Climate Report. It’s the usual mix of bad weather events and the claim that the “climate continues to change”, when it is doing no such thing. I will take a closer look in a day or two. But I want to look first at that blatantly fake claim about sea level rise.
First a look at the map they show:

Their claim of 5.2mm is the adjusted for GIA at Stornaway. But as the report goes on to state, the measurements at Stornaway are not reliable, and should be used with caution:

It is shockingly irresponsible for the Met Office to use the Stornaway figures so prominently.
But what about the other sites?
The trends conveniently begin in 1991, the year of the Pinatubo explosion, which drastically cooled the Earth for the next couple of years, and consequently caused sea levels to drop. We can see the effect at Newlyn. This drop, of course, has artificially increased the 30-year trend.

https://www.psmsl.org/data/obtaining/stations/202.php
The annual change also highlights just how volatile sea levels can be in the short term. However, if we look at the decadal changes, a clear pattern emerges:

There was a sharp increase in 2002, as the Pinatubo linked sea level falls unwound. But since then, decadal changes are similar to most of the record since 1916. In the last ten years, sea have risen by 42mm, in line with the Met Office’s 4.2mm a year. The Met Office compares this with the long term rise of 1.84mm. However, what they don’t explain is that there have been many periods with similar rates of rise to now, but that these were interspersed with other periods when seas fell, notably the global cooling period in the mid 20thC.
It is evident from the chart below that there is no acceleration, as they claim:
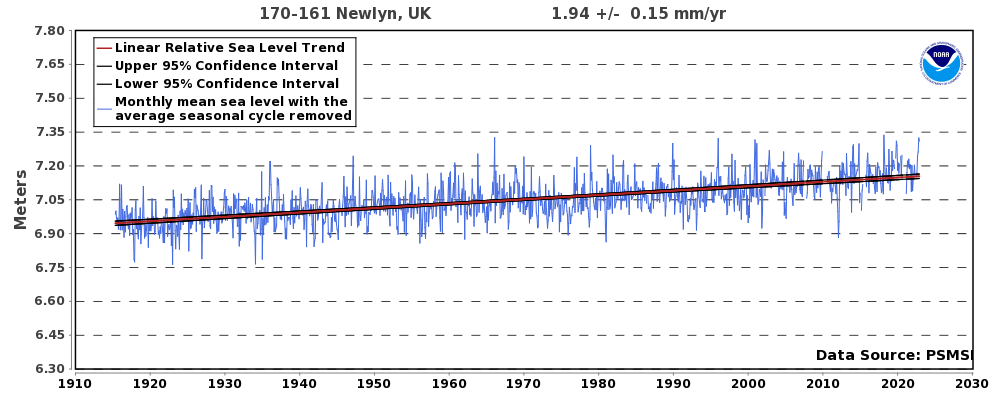
https://www.tidesandcurrents.noaa.gov/sltrends/sltrends_station.shtml?id=170-161
At North Shields, it is clear that sea level rise has actually been slowing down in the last two decades, and the rate of rise is lower than for most of the last century:

https://www.psmsl.org/data/obtaining/stations/95.php
The Met Office report deliberately distorts what the data is actually saying, with the intent to mislead the public into believing the ever sillier predictions of apocalyptic sea level rise coming our way.
The Met Office also claims that the UK data is consistent with the global data:

In which case, they must also accept that the global data shows no sign of acceleration either!