By Anthony Watts and Sterling Burnett
It appears Associated Press science writer Seth Borenstein has “hit one out to the park”, unfortunately for him, it’s a foul ball. In a recent story that got wide pickup by multiple media outlets. Borenstein made this claim:
Climate change is making major league sluggers into even hotter hitters, sending an extra 50 or so home runs a year over the fences, a new study found.
Hotter, thinner air that allows balls to fly farther contributed a tiny bit to a surge in home runs since 2010, according to a statistical analysis by Dartmouth College scientists published in Friday’s Bulletin of the American Meteorological Society. They analyzed 100,000 major league games and more than 200,000 balls put into play in the last few years along with weather conditions, stadiums and other factors.
“Global warming is juicing home runs in Major League Baseball,” said study co-author Justin Mankin, a Dartmouth climate scientist.
It’s basic physics.
“Basic physics” or not, the claim is unverifiable. While many could see extra home runs as clear benefit of climate change, the premise of the study, published in the Bulletin of the American Meteorological Society, is the science equivalent of a swing and a miss. The reason is that the study assumed that increased temperature (due to climate change) would decrease air density, and therefore allow baseballs to fly faster and further due to less air resistance. The study provides this graph as proof, seen in Figure 1.
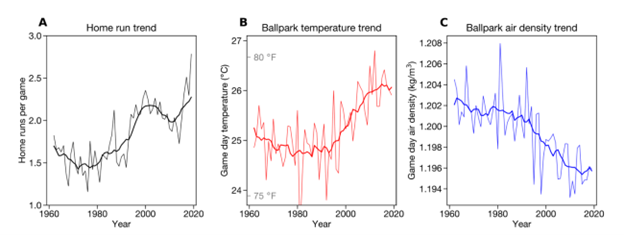
The study compared baseball and select weather data back to 1962. There has been a substantial increase in home runs over the time period studied, but correlation is not causation, and study authors failed to examine a myriad of other factors that are far more likely to be responsible for the increase in home runs, than the small increase in field air temperatures and the decrease in air density.
Among the study’s weaknesses are first, they assume that the modest increase in field temperature, is entirely due to anthropogenic greenhouse gas emissions. This ignores other factors that influence temperatures, like the urban heat island effect, nature’s own contribution, and the fatally flawed siting of surface stations measuring temperatures.
Second, they think they can tease out approximately 50 home runs per year, about 1 percent of the home run increase, using counterfactual computer model simulations of what they think temperatures would have been absent human greenhouse gas emissions. As Climate Realism has pointed out repeatedly, the computer model temperature simulations are critically flawed. Attributing a one percent share of a much larger increase in home runs to climate change based on counterfactual computer model simulations is an endeavor fraught with uncertainty.
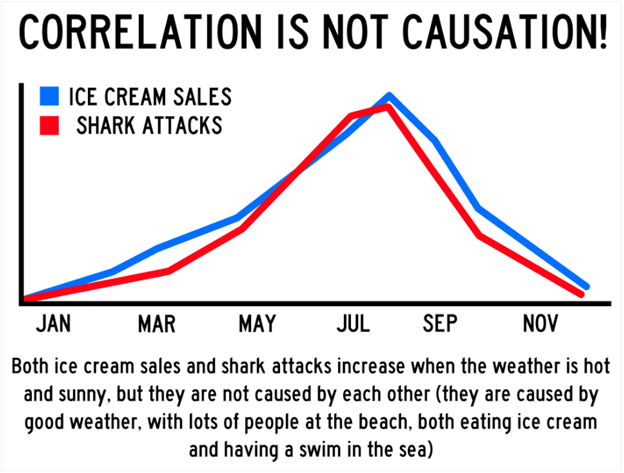
The study is a textbook case of correlation is not causation, with a dose of confirmation bias added in. A visual correlation between variables, such as temperature, air density, and home runs, does not automatically mean that the change in one variable is the cause of the change in the values of the other variable. Without looking at other factors, the “climate change equals more home runs” theory becomes just like the infamous Ice Cream vs. Shark Attacks graph that is used to instruct students on how not to compare data. See Figure 2 from Simple Psychology’s website.
While variables like temperature and air density correlated because a change in temperature does in fact change air density, the scientists failed to examine several other other factors, called confounding variables, which are far more likely to be responsible for the increase in home runs.
Some examples would include better and newer baseball stadiums which reduce wind on the field, and thus limiting the number of long fly balls blown foul. Some newer stadiums also have retractable roofs, which keep out weather which may not only affect the ball, but the mood and confidence of the hitter.
In fact, an analysis of baseball statistics, done by The Bleacher Report found some stadiums have consistently higher number of hits and home runs, and these facts stand on their own without climate change being figured in at all.
Since the study claiming climate change made more home runs only went back to 1962, they ensured that the data was mostly about newer baseball parks, with the improvements for weather and wind mitigation built in. This exclusion of pre-1960 baseball and weather data (the game goes back to the late 18th century) essentially becomes an exercise in cherry picking data that supports the present era of climate change while ignoring other hot weather events in the United States.
For example, during the “dust bowl years” of the United States from 1930-1936, weather patterns brought some of the hottest summers on record to the United States, especially across the Plains, Upper Midwest and Great Lake States. High temperatures then during those summers were even warmer than today, as seen in Figure 3:
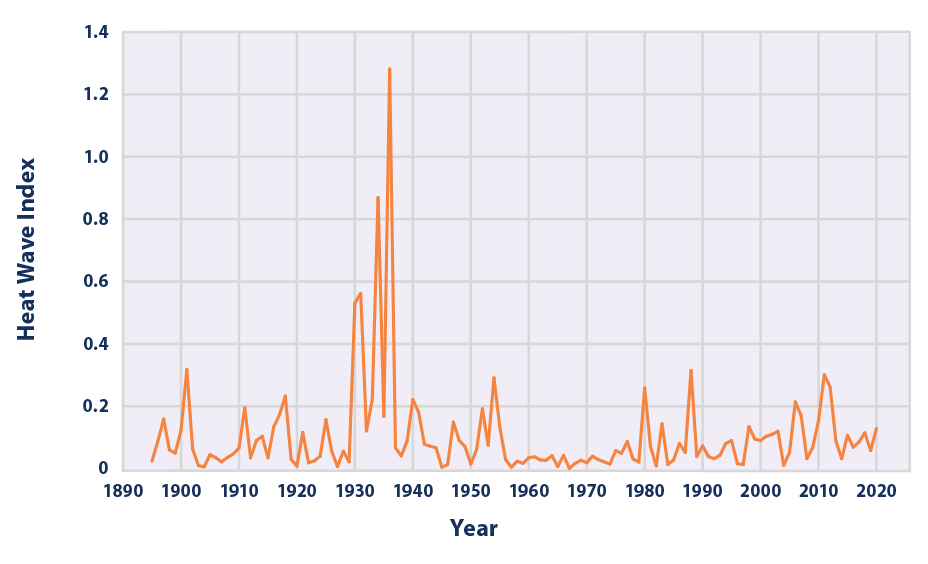
With those dust bowl era hot and dry conditions, air density would have been lower, and thus, if the premise of warmer climate equals more home runs were true, we’d expect to see a big spike in home runs during that time.
But, the data compiled on both the National and American Leagues home runs says clearly there wasn’t any spike, meaning climate change as a causal factor driving home run totals strikes out. Other confounding factors must be at work, and baseball aficionados are well aware of and have bemoaned them.
The home run increase has coincided with number of changes in the game that are far more likely to account for the increase in home runs than a modest, approximately 1℃ increase in temperature.
First, the upward trend in home runs began in 1977, when the major league baseball expanded by two teams, two more teams were added in 1993, including the Colorado Rockies, who play in a stadium more than a mile above sea level where air pressure is naturally less dense. Two more teams were added in 1998. With more teams one would expect an increase in home runs. The Dartmouth team may have accounted for this factor, but what they may not have considered is how each additional team added dilutes the pitching pool. Younger, less experienced pitchers are called up from the minor leagues, or drafted out of college and even high schools, and added to major league rotations sooner with less training or experience than is usual, facing batting talent the likes of which they’ve never faced before. In addition, to round out pitching staffs, older pitchers, some past their prime, are kept on rosters.
In addition, most MLB ballparks have been replaced within the study period, with only a few older stadiums remaining, such as Fenway Park and Wrigley Field. Critical to an analysis of home run data is the fact that almost every new ballpark has smaller field dimensions than the ballparks they have replaced. Some new parks have center fields that are 20 to 40 feet less deep than the teams’ previous fields of play. A number of the new ball parks had lower outfield fences or have since construction, shortened the existing outfield fences. Adjustments, even in new ballparks, continue to this day. Shorter distances to the outfield wall and lower fences allow what would have been previously routine fly balls or doubles off the wall to become home runs now.
Plus, it is no secret that all MLB teams now have hitting coaches, who use science to improve the swing and delivery of batters. In fact, the Los Angeles Dodgers has an online “hands-on Science, Technology, Engineering and Mathematics (STEM) curriculum and programming to elementary and middle school teachers and students in Los Angeles” to provide up and coming players with the same science the MLB uses to improve hitting scores. Also during the study period, analytics has been used to monitor and encourage higher “launch angles.” Home run hitting is glamorized and emphasized by teams, and emphasis on a high batting average is downplayed. The result has been clear, lower team batting averages, more strikeouts, and more home runs. That is the general trend.
Also, during the study period, baseball went through what has been referred to as the steroid era when “multiple” records were set and balls were flying out of ballparks left and right. Research indicates that steroid use likely began in the mid-1980s, coincident with the initial rise in home run numbers and had permeated the game by 1994. The years 1994 through 2004 are typically thought of as the “Steroid Era.” The year 1998 saw a tremendous number of home runs and records broken tied to steroid use.
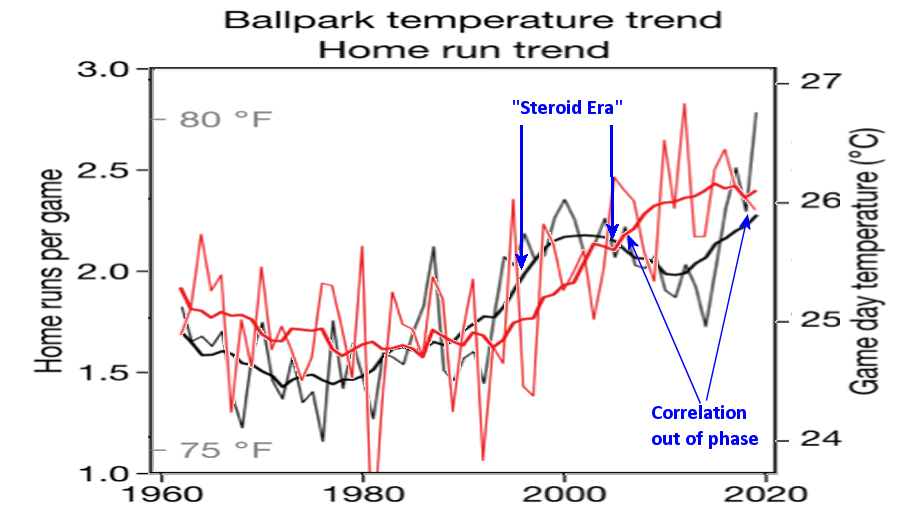
Evidence for the impact of steroids on home run totals is even found in Figure 1 provided in the Bulletin of the American Meteorological Society study. Home run totals peaked in the early 2000s as rumors and investigations of steroid use began to take hold in baseball, only to fall precipitously around 2003 for nearly a decade as new testing regimes and penalties were implemented. During that decade, even as home run numbers fell, temperatures continued their modest upward trajectory and air pressure its decline – in order words, home run trends then do not correlate with temperatures and air pressure, supposedly the climate drivers of home run totals.
In this combined/overlaid and expanded for improved readability graphic from the original study (Figure 1, panels A and B), temperature and home runs shown are shown together in Figure 4. It is very easy to see the impact of steroids on home run totals starting in the late 1990s and ending in 2003. Figure 4 also clearly shows that from about 2009 to 2018, the correlation between temperature and home runs goes completely out of phase, with no correlation at all.
Clearly, many factors are at play in home run hitting trends in baseball. The study’s authors and the Associated Press seem oblivious to other factors when they attributed increasing home run totals to climate change, while ignoring or downplaying other factors which arguably have a more direct causal impact. Consider this one more climate scare story—if one considers a modest climate induced 1 percent increase in home runs, scary, or even noteworthy—debunked. One wonders if taxpayer funded government grants helped fund this groundbreaking “research.”