


A June 26 article in the Washington Post (WaPo) titled “The places in the U.S. most at risk for extreme rainfall” makes this claim in the subtitle “New data from the nonprofit First Street Foundation finds that climate change is fueling more devastating rains and flooding in parts of the country.” The claim is grossly misleading, because it is based on a model, and because there are factors associated with rainfall patterns and rainfall measurement that were not taken into consideration.
In the article, WaPo cites a climate advocacy group, First Street, as the source of the claim:
But in this area and others across the country, such devastating precipitation is becoming more common as the world grows warmer, according to new data released Monday by the nonprofit First Street Foundation.
In a new peer-reviewed model, the group says the U.S. government’s current precipitation frequency estimates, considered the authoritative source for planning and infrastructure design nationwide, do not fully capture the frequency and severity of extreme precipitation in a changing climate. What now qualifies as a “1-in-100 year storm” — in short, an event with a 1 percent chance of happening any given year — is already happening more often in some places.
Taking the study itself by nonprofit First Street Foundation, which has a history of publishing climate alarm predictions, with a grain of salt, the claim is based on a model output result, rather than actual measurements, using wet-biased input data with a short history. These two factors create a misleading result.
In the map provided for the WaPo article, seen in the Figure below, there are some interesting patterns:
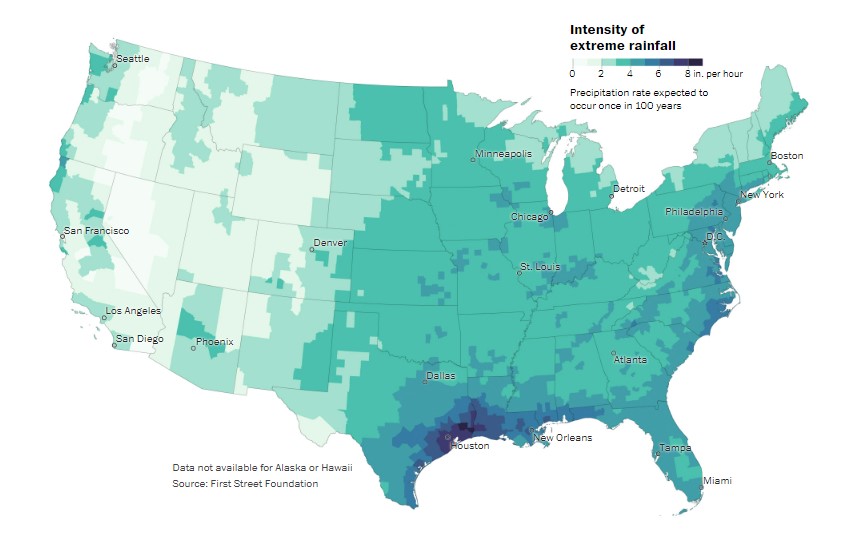
Note that the most intense areas are coastlines, such as the Gulf Coast, East Coast, and parts of the West Coast. This is not surprising, since these are areas next to oceans with the greatest amount of available precipitable water.
In fact, that map really isn’t any different than the 30 year climatology of rainfall for the contiguous United States, except in the Houston area. That Houston anomaly can be explained by a single storm, Hurricane Harvey, the first major hurricane to make landfall in the United States since 2005, which dumped more than 40 inches of rain in the Houston area. According to Climate.gov:
The highest rainfall amount totaled 48.20 inches at a rain gauge on Clear Creek and I-45 near Houston Texas. It was the highest rainfall amount in a single storm for any place in the continental United States.
As we know from Climate at a Glance: Hurricanes, there is no observed climate change signal in hurricane numbers. Even the U.N. Intergovernmental Panel on Climate Change agrees, finding no increase in the frequency or severity of hurricanes. So, even that one-time intense rainfall on Houston from Hurricane Harvey can’t be linked to climate change.
So where does WaPo and First Street get the increase in rainfall severity from the rest of the country from? Airports and short term data. In the study abstract, First Street says:
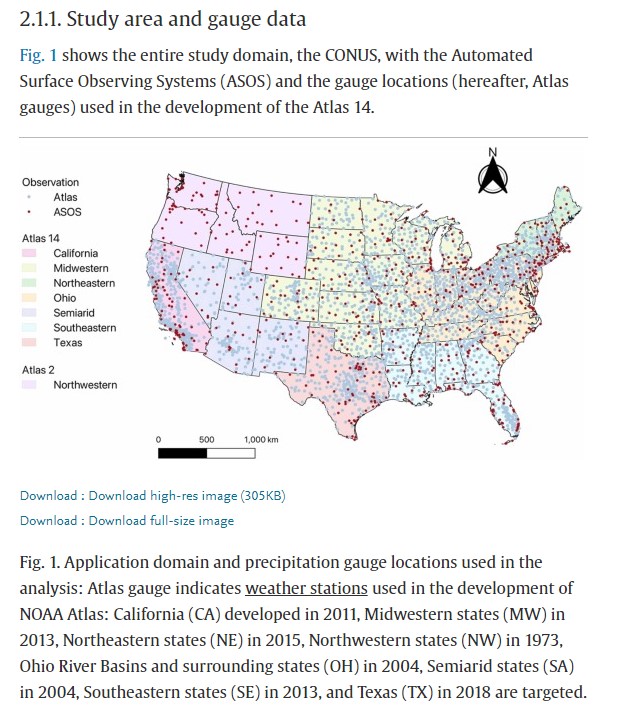
The NOAA Atlases have provided the standard precipitation frequency estimates (PFEs) for over two decades in the United States, but they are losing that status due to climate change. This study evaluates the Atlases compared to new PFEs developed based on the Automated Surface Observing System and Regional Frequency Analysis (ASOS-RFA) as a benchmark.
For those who don’t know, the Automated Surface Observing System (ASOS) is an observation system jointly managed by the National Oceanic and Atmospheric Administration (NOAA) the Federal Aviation Administration (FAA) designed to monitor airport runways, not climate change. Some, but not all ASOS systems record rainfall observed at airports. This is the rainfall data that First Street put into their model.
There’s two problems with using ASOS data. First, it has been established in another peer reviewed study in 2011 (which wasn’t cited by First Street’s study) that the airport environment tends to give higher rainfall readings:
Researchers have found that areas near commercial airports sometimes experience a small but measurable increase in rain and snow when aircraft take off and land under certain atmospheric conditions.
…
“It appears to be a rather widespread effect for aircraft to inadvertently cause some measureable amount of rain or snow as they fly through certain clouds,” Heymsfield says. “This is not necessarily enough precipitation to affect global climate, but it is noticeable around major airports in the midlatitudes.”
The combination of aircraft exhaust (soot) acting as condensation nuclei, plus turbulence and mixing of the atmosphere by aircraft is apparently enough to create a cloud seeding effect, resulting in more rainfall at the airport.
So, the airport ASOS data First Street used in their model was biased higher from the beginning. And, since the trend for the number of commercial airport flights has seen a steady upwards rise over the last two decades, it is reasonable to assume that the effect on rainfall around airports has also increased. First Street and WaPo didn’t take that into account.
Plus, there’s the length of rainfall record that is questionable. According to NOAA’s ASOS User Guide, the implementation of ASOS didn’t happen until the 1990’s, which means that there’s only about 30 years (possibly less) of rainfall data to examine. Further, the other data source used in the study, Atlas 14, didn’t come into existence until about a decade ago according to the study itself:
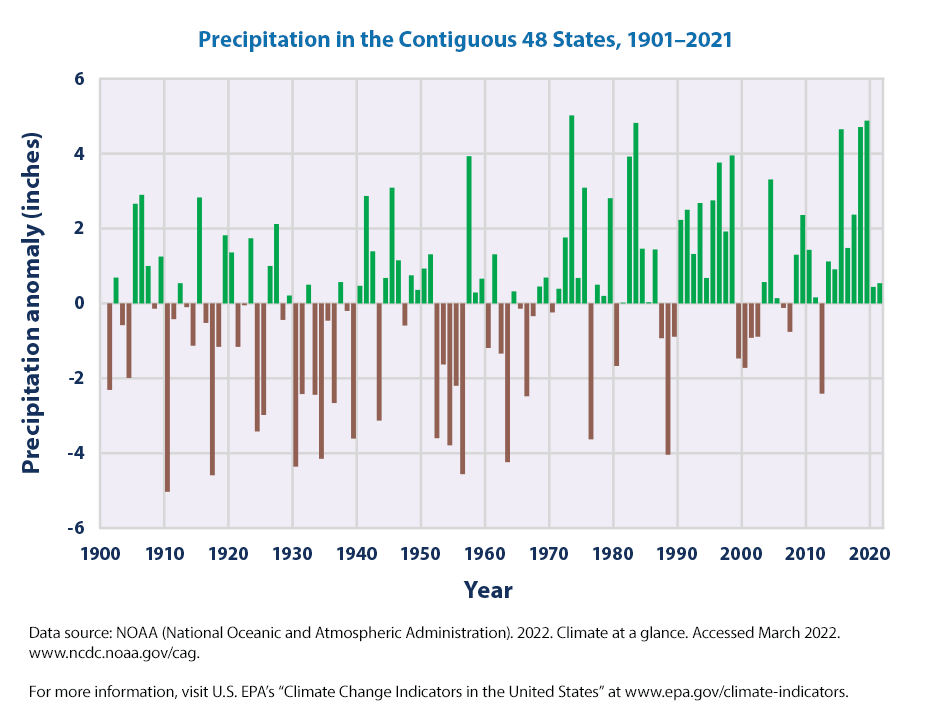
This means that some data from Atlas 14 might even be less than a decade old. But, the long term rainfall data for the U.S. shows that it has been naturally increasing for a long time, seen in the figure below, something First Street didn’t mention. The U.S. Environmental Protection Agency (EPA) has this to say:
On average, total annual precipitation has increased over land areas in the United States and worldwide. Since 1901, global precipitation has increased at an average rate of 0.04 inches per decade, while precipitation in the contiguous 48 states has increased at a rate of 0.20 inches per decade.
Finally, the Intergovernmental Panel on Climate Change (IPCC) AR6 report, Chapter 11, Weather and Climate Extreme Events in a Changing Climate, concludes that changes in the frequency and intensity of most severe weather events (with corresponding intense rainfall) have not been detected nor can they be attributed to human caused climate change.
First Street really hasn’t discovered anything new, but what they did do is use biased and short term data to spin a claim that is not supported by any other climate science.
All in all, First Street did a shoddy job of science, ignoring older data in favor of data that gave them the result they were looking for. WaPo authors Kevin Crowe, John Muyskens, and Brady Dennis apparently didn’t have the skills to critically review the claims made by First Street and published their claims without any critical review as if they were fact. WaPo did a shameful job of journalism, misleading their readers into thinking something that simply isn’t true.


Apr 22, 2022 Climate Emergency! | Marianne Williamson in conversation with climate Scientist Peter Kalmus
Marianne Williamson interviews climate scientist Peter Kalmus for Earth Day.
https://youtu.be/DN9wygxKexQ