On Wednesday, July 25, ABC13 in Houston reported on the city’s temperatures from new data that accounted for the Urban Heat Island effect (UHI) within the city and its surrounding suburbs. The results from the data show that Houston experiences a UHI impact of six degrees Fahrenheit or greater on any given day.
In the article, ABC13 News acknowledges what The Heartland Institute has long pointed out, the urban heat island effect impacts measured temperatures and people’s lives. They cite an example, saying:
Say the forecast high temperature is 90 degrees. Factor in the additional warmth from the urban heat island, and it could feel like 95 degrees in Rosenberg, 97 in Humble, 98 downtown, or even 99 in Baytown.
The story also notes that the UHI is greater with a broad reach than previously acknowledged, even effecting less densely populated areas.
This finding parallels what was revealed in the 2022 Heartland Institute report Corrupted Climate Stations: The Official U.S. Surface Temperature Record Remains Fatally Flawed which found approximately 96 percent of U.S. temperature stations used to measure climate change fail to meet what the National Oceanic and Atmospheric Administration (NOAA) considers to be “acceptable” and uncorrupted placement by the agency’s own published standards. The UHI effect, which grows along with the size of cities, creates artificial warming at many long-term temperature stations.
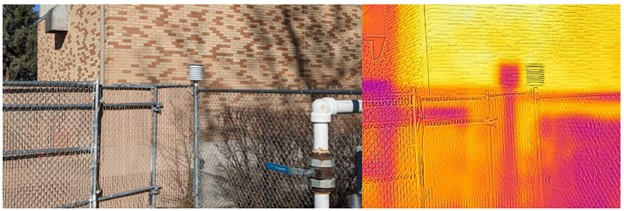
As was found in Houston, weather stations within the UHI effect read higher temperatures, meaning temperatures recorded at these stations are warmer than they would be absent the presence of artifacts of development, like buildings, parking lots, and machinery that have been built up or are in use around them which trap and/or generate heat. From that report, for example, Figure 1 shows a station in rural Dillon, MT that is biased warmer due to its proximity to a sunlit brick wall.
The chart below, found on page 17 of the report, shows 30 years of data from NOAA temperature stations in the Continental United States (CONUS). The blue lines show recorded temperatures and the trend from stations that comply with NOAA’s published standards. The yellow lines are temperatures taken from stations that are not compliant with those standards (i.e. near artificial hot spots). The red lines are the “official” adjusted temperature released by NOAA.
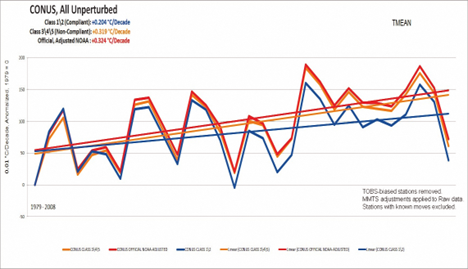
If you look at the blue line in Figure 2 of unperturbed stations that adhere to NOAA’s published standard – ones that are correctly located and free of localized urban heat biases – they display about half the rate of warming compared to perturbed stations that have UHI biases. Extrapolating from the U.S. data, on average, urban heat islands increase the global surface temperature trend by almost 50 percent.
Like the Houston UHI finding, the issue of localized heat-bias was proven in a real-world experiment conducted by NOAA’s laboratory in Oak Ridge, Tennessee and published in a peer reviewed science journal.
The UHI has long been either ignored and/or its impact on temperatures downplayed in the climate debate, despite the fact that it clearly significantly influences daily temperature measurements, as well as long-term climate trends. Kudos to ABC13 in Houston for reporting honestly on how the UHI affects Houston’s temperatures.