Guest Post by Roy W. Spencer, Ph. D.
We are now getting close to finalizing our methodology for computing the urban heat island (UHI) effect as a function of population density, and will be submitting our first paper for publication in the next few weeks. I’ve settled on using the CONUS (Lower 48) U.S. region as a demonstration since that is where the most dense network of weather stations is. We are using NOAA’s V4 of the GHCN monthly dataset.
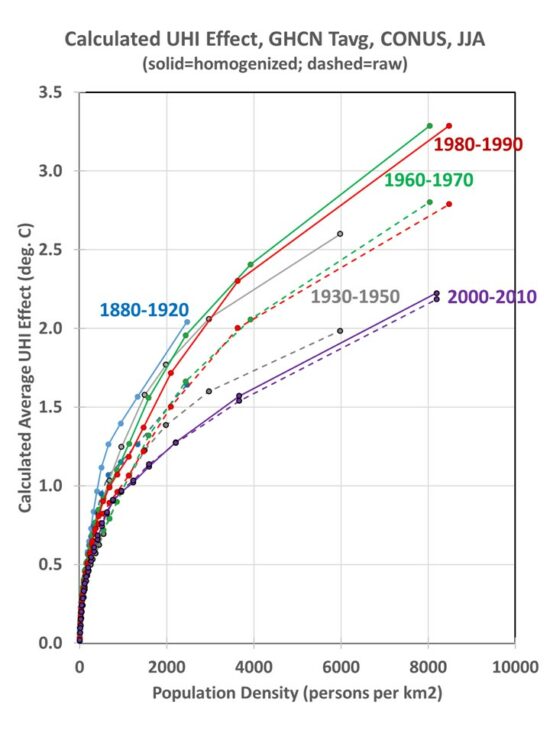
I’ve previously described the methodology, where I use many thousands of closely-spaced station pairs to compute how temperature between stations change with population density at 10×10 km resolution. This is done for 22 classes of 2-station average population density, and the resulting cumulative UHI curves are shown in Fig. 1.
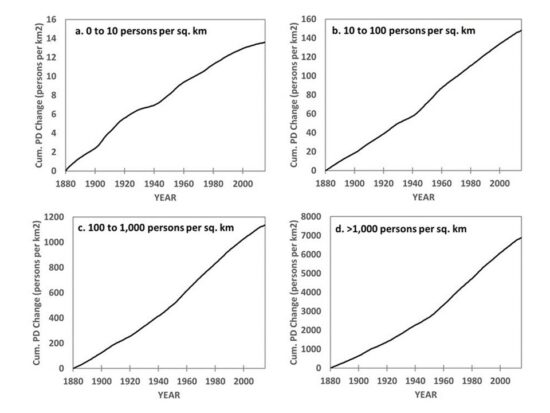
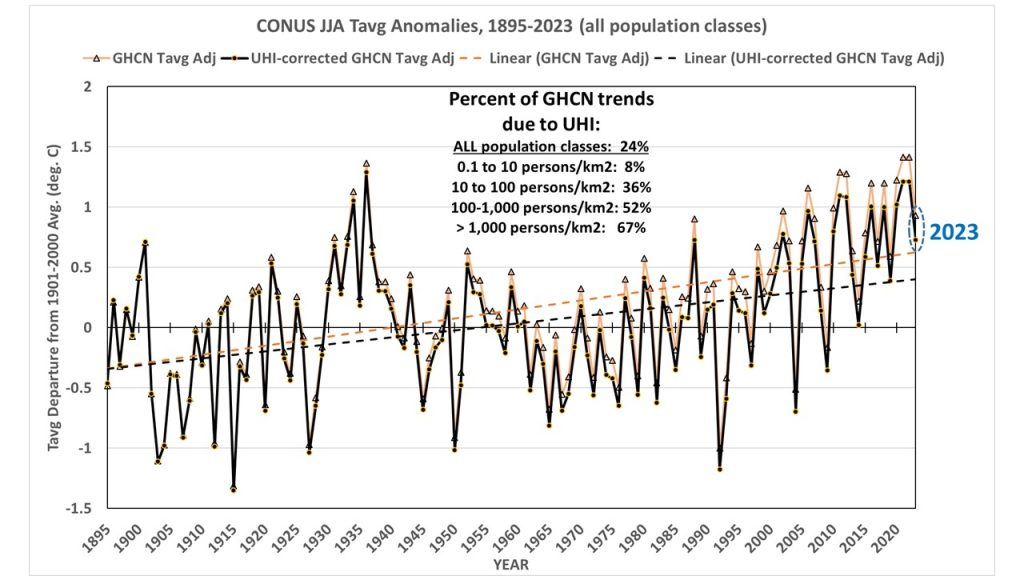
The regression estimates of change in temperature with population density (dT/dPD) used to construct the curves in Fig. 1 were used at each individual station in the U.S. and applied to the history of population density between 1895 and 2023. This produces a UHI estimate for each station over time. If I compute the area-average GHCN yearly summertime temperature anomalies and subtract out the UHI effect, I get a UHI-corrected estimate of how temperatures have changed without the UHI effect (Fig. 3).
The data in Fig. 3 are from my 1 deg latitude/longitude binning of station data, and then area-averaged. This method of area averaging for CONUS produces results extremely close to those produced at the NCDC “Climate at a Glance” website (correlation = 0.996), which uses a high resolution (5 km) grid averaged to the 344 U.S. climate divisions then averaged to the 48 states then area averaged to provide a CONUS estimate.
UHI Warming at Suburban/Urban Stations is Large
The UHI influence averaged across all stations is modest: 24% of the trend, 1895-2023. This is because the U.S. thermometer network used in Version 4 of GHCN is dominated by rural stations.
But for the average “suburban” (100-1,000 persons per sq. km) station, UHI is 52% of the calculated temperature trend, and 67% of the urban station trend (>1,000 persons per sq. km). This means warming has been exaggerated by at least a factor of 2 (100%).
This also means that media reports of record high temperatures in cities must be considered suspect, since essentially all those cities have grown substantially over the last 100+ years, and so has their urban heat island.
Originally posted by Dr. Roy Spencer, here, reposted with permission.