


Guest Post by: The Competitive Enterprise Institute, The Heartland Institute, the Energy & Environmental Legal Institute, the Committee for a Constructive Tomorrow, and the International Climate Science Coalition, and Truth in Energy and Climate.
Editor’s note: This summary serves as a fact check on the biggest false claims made in the media in October, 2023.
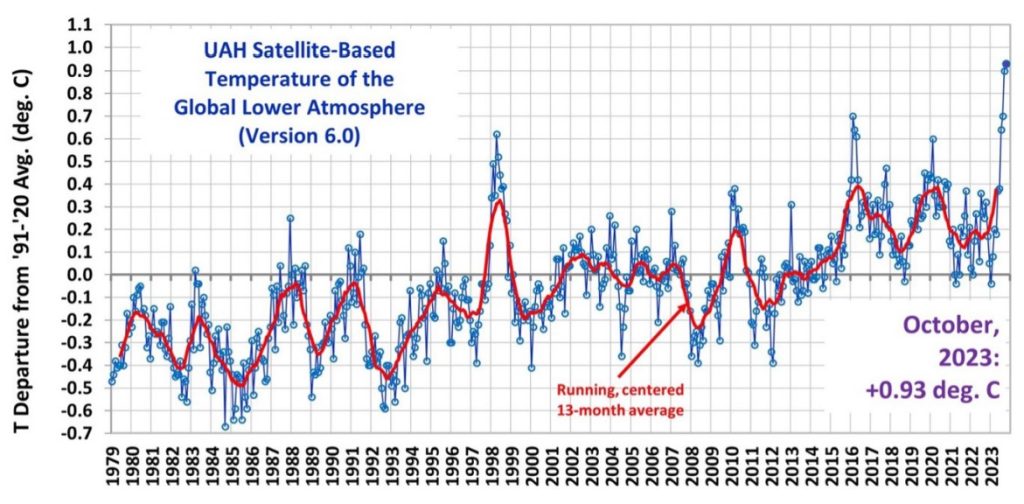
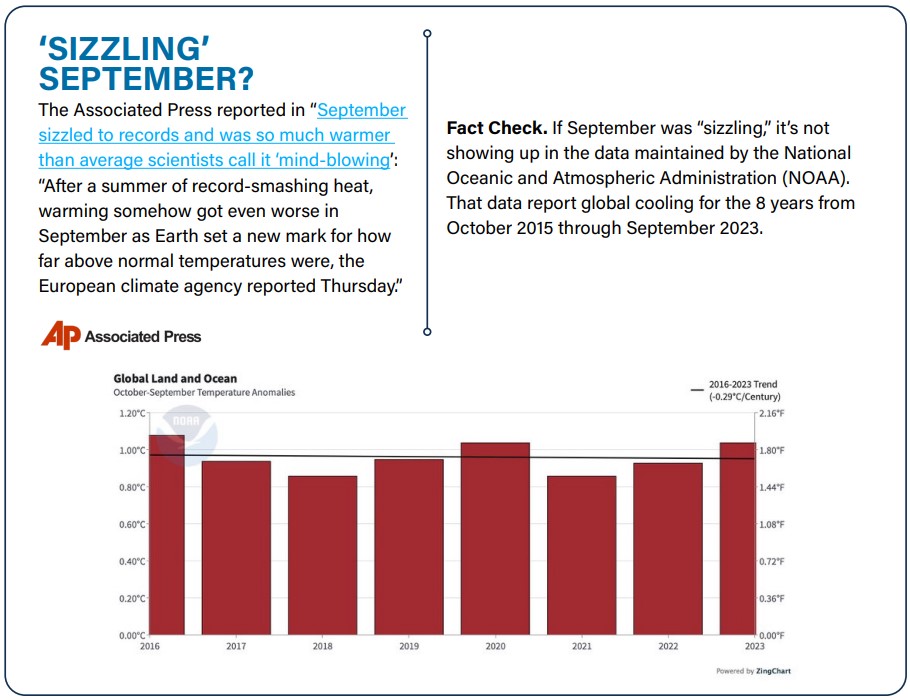
If you thought the September 2023 NASA satellite estimated average global temperature anomaly (0.90°C) was high, October topped it at 0.93°C.
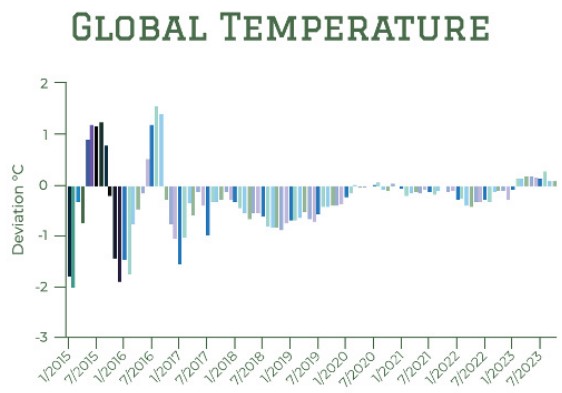 But just as occurred in September, the estimated average global temperature based on Temperature.global’s real-time surface station measurements reported October as no big deal temperature-wise, even continuing the trend of global cooling reported since its record began in January 2015.
What is to be made of this discrepancy?
As remarked in September, regardless of the data used to estimate it, “average global temperature” is not an actual physical metric. It is a flawed notion contrived by and for global warming alarmism. Its estimation is fraught with problems. We only discuss it because the alarmists do.
Sure 2023 has been an unusual year so far. But the key question remains: Has 2023 weather been driven or caused by emissions? A reasonably correct answer comes, surprisingly enough, from NASA’s chief climate alarmist, Gavin Schmidt who told the Washington Post: “It is indeed hard to give a good and informed answer to why this is happening.”
We can agree with that. On to our ten climate fact checks for October.
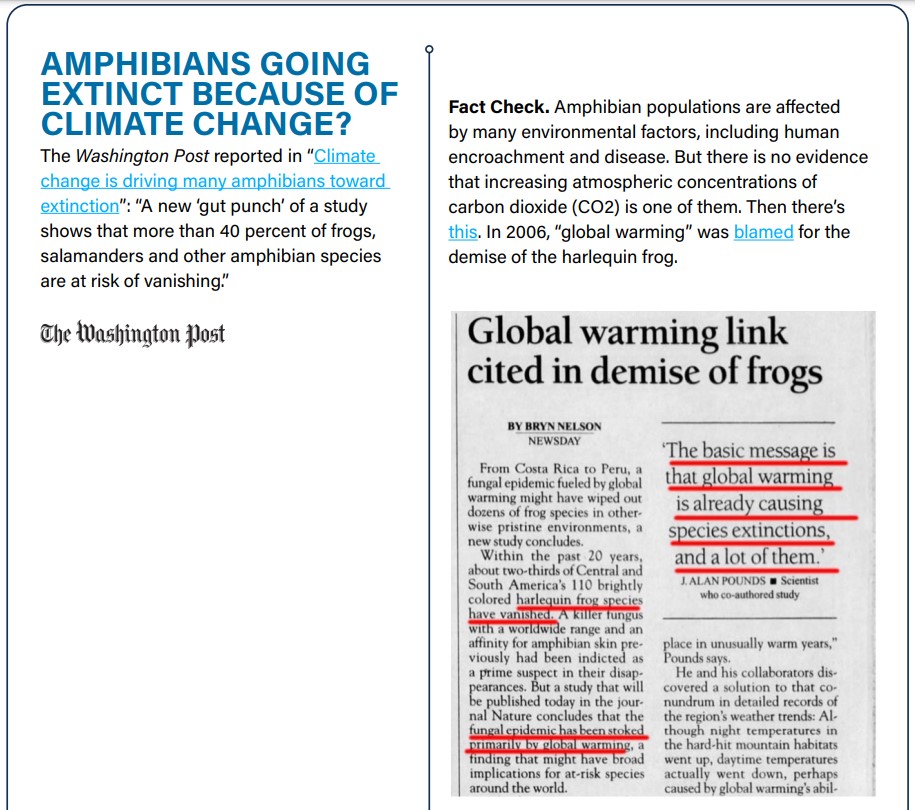
But after 15 years of “global warming,” the harlequin frog was “back from the dead.”
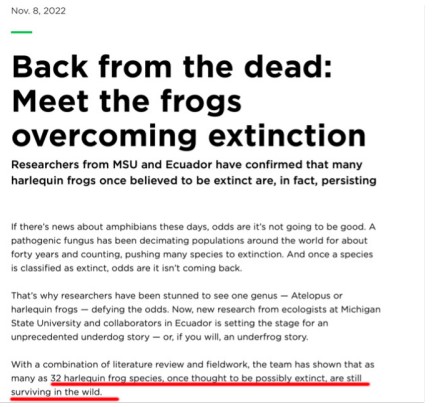
Links: The Washington Post article, commentary and newspaper link for harlequin frog.
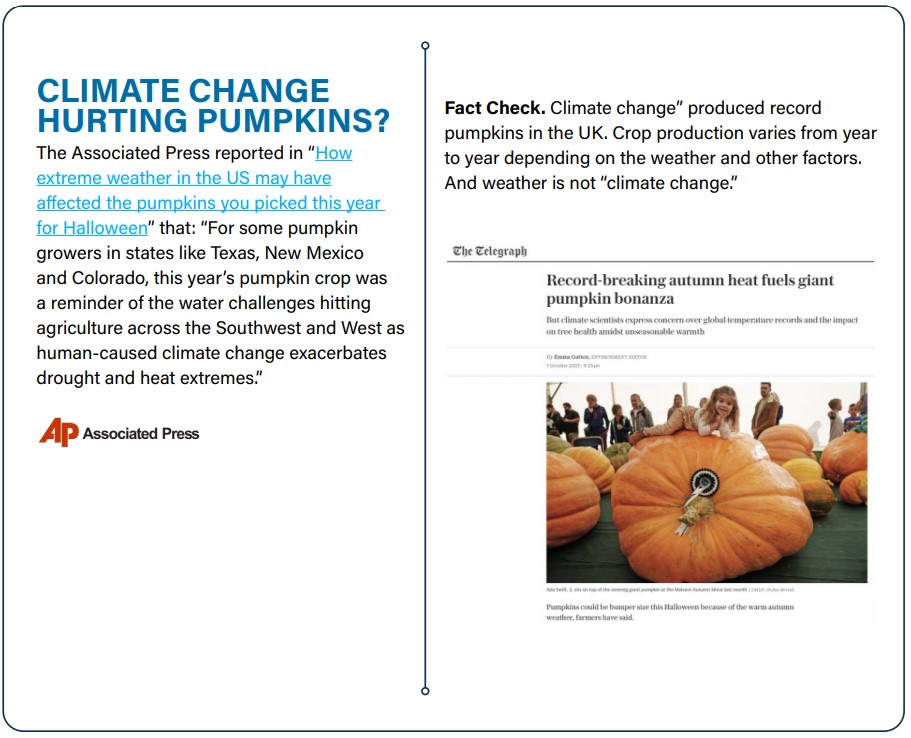
Links: Associated Press article.
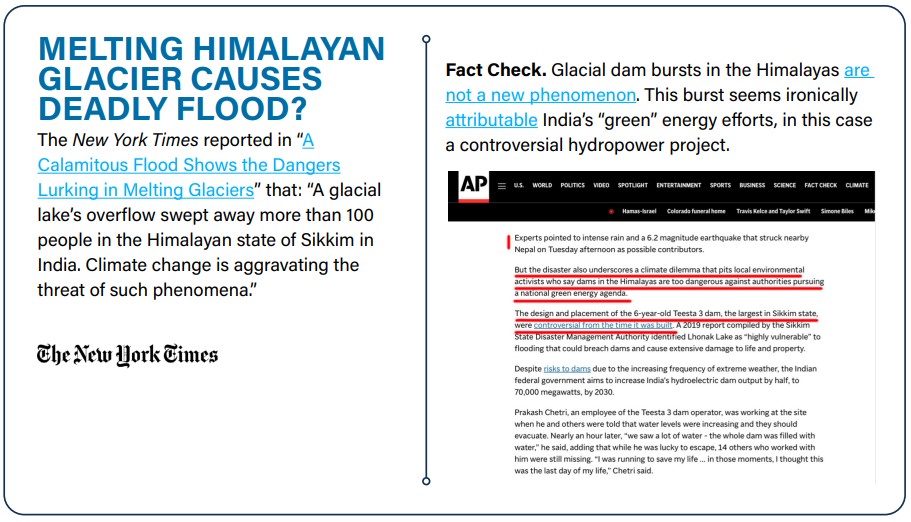
Links: The New York Times article, glacial dam bursts history, hydropower in India.
Links: The Associated Press article.
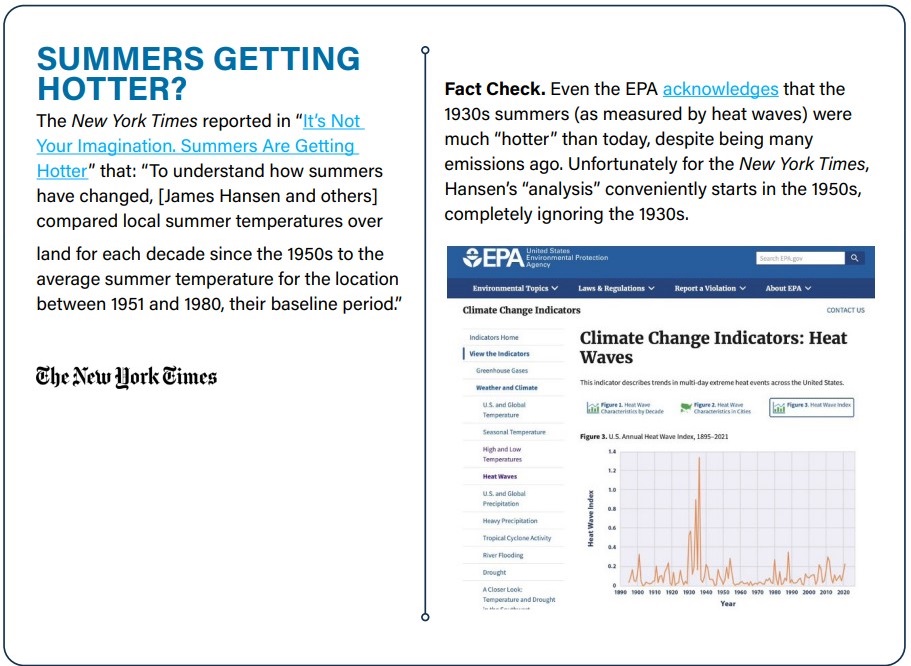
Links: The New York Times article, EPA heat wave page.
Links: The Associated Press article.
Links: The Associated Press article, October temperatures.
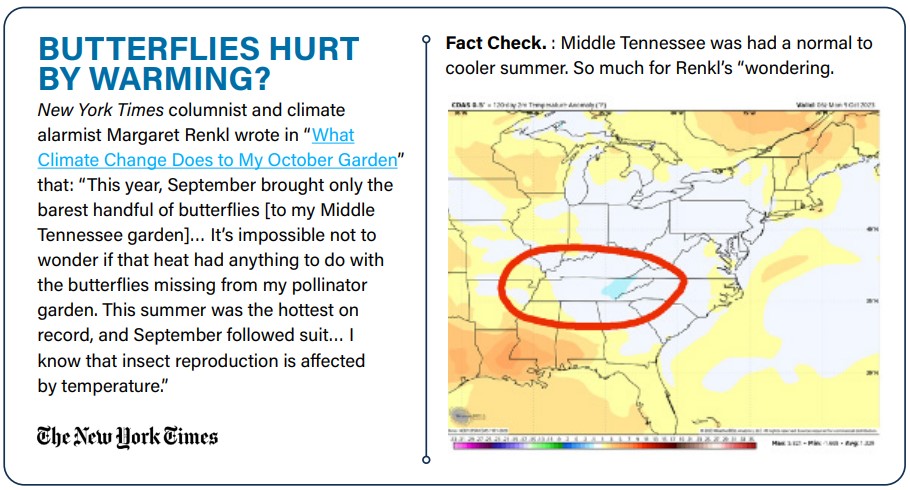
Links: The New York Times article.
Links: The Associated Press article.
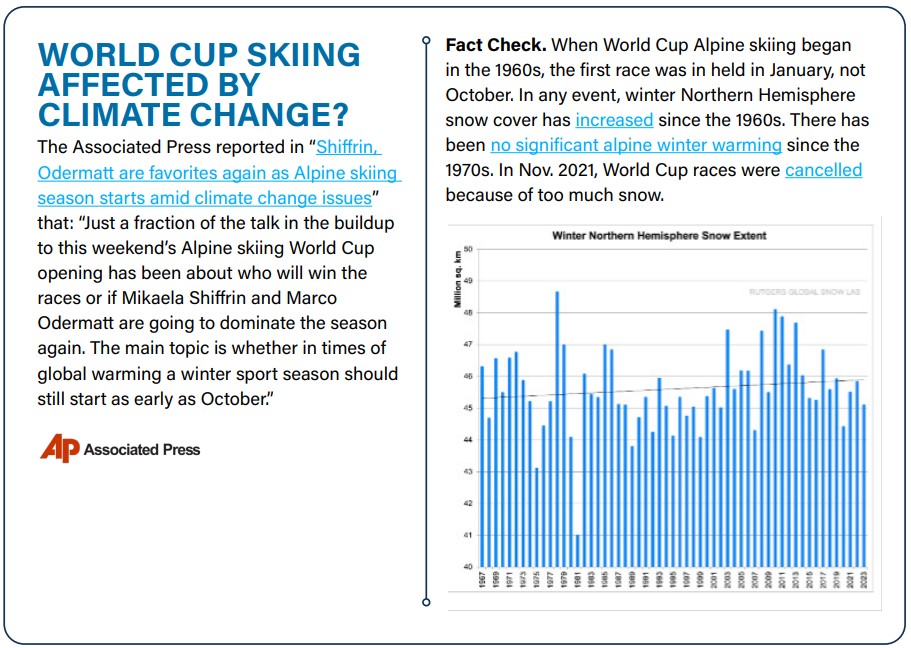
Links: The Associated Press article, Northern Hemisphere snow cover, alpine winter warming, 2021 World Cup.
This month closes out with a new report exposing the absence sound data and models in global warming alarmism from the Statistics Norway, the official government statistics bureau of Norway. The report concludes that the effect of CO2 emissions is not sufficiently strong to affect global temperatures in any systemic way. It’s a significant report as the Norwegian government postures on the alarmist side of the climate controversy.
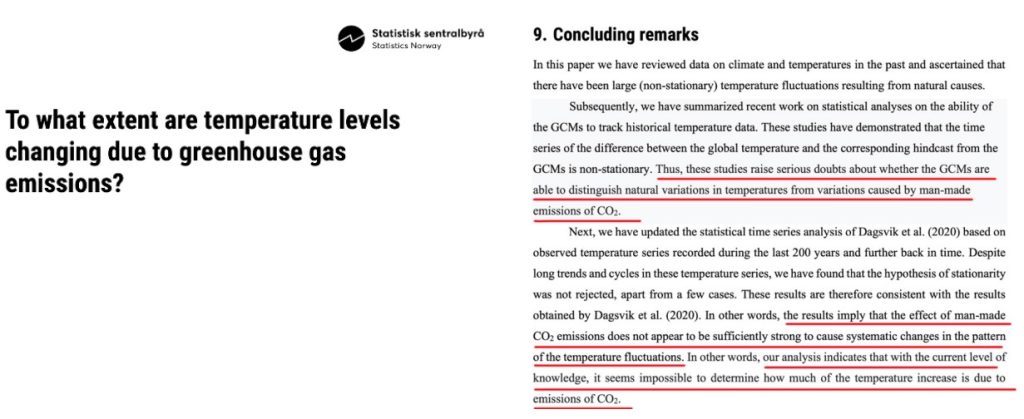
You can check out the report here or this X.com thread with the highlights. BTW, there has been no media coverage of this landmark study.
Until next month and for more great climate fact checks from October 2023 check out:
- Stop Misinforming about Malaria’s Spread, Washington Post
- Media Fails to Examine Actual Data in Making “Hottest Summer Ever”
- Wrong, ABC News, Data Refutes Strengthening Hurricanes Claim
- NYT Claims Record September Temperature Indicates Accelerated Climate Change- It Doesn’t
- CBS News Peddles Climate Attribution Misinformation on Canada’s Wildfires
- This Isn’t the First Time in Human History Our Winters Have Become Milder
- History: Cold is Horrifically Bad for Humanity
- Megadrought? What Megadrought?
- CO2 Rocks!
- Inundated Islands? The Science Says “No”
- Los Angeles Times Misrepresents California Central Valley “Weather” as “Climate”
- To Be Clear, Minnesota Public Radio, Allergies Are Manageable, Extended Growing Seasons Benefit Everyone
- Floods & Tornadoes in 1954 and What Caused Severe Floods in the 1950s, Sky News
- Washington Post: Climate change is the catastrophe to end all others
- Antarctica’s melting ice shelves have unleashed 7.5 TRILLION tonnes of water into the oceans since 1997–Daily Mail
Originally posted at JunkScience.com, reposted with permission.
Presented by the Competitive Enterprise Institute (CEI), the Heartland Institute, Energy & Environment Legal Institute, Committee for a Constructive Tomorrow (CFACT), the
International Climate Science Coalition (ICSC), and Truth in Energy and Climate.


Amazing how the climate change alarmists blame every ecological crisis on climate change! It’s like saying every health issue is caused by diet change even though it could be many factors contributing to the issue! No single factor can be explained to cause a difference unless there is a control factor involved, like taking a placebo instead of the drug itself! Climate alarmists have an agenda just like blaming everything negative in the climate on fossil fuels when we know similar events have occurred without the influence of fossil fuels. Don’t fall for their propaganda and distortions of reality!
Re: ‘Sizzling September’ & the NOAA ‘Global Land & Ocean’ temperature graph. Seeing this graph I searched for it on NOAA’s website & found it in the ‘Climate at a Glance’ section. I then selected the parameters until I got the chart that appears in the article on this page. Using other parameters it’s possible to get a chart with alarming results for September alone. By setting the time scale to 1 month. It gives an alarming +1.44 degrees C anomaly for September & a trend of +5.10 degrees C per century. It appears that one can produce alarm or calm with the same set of data simply by manipulating the parameters. Such are statistics.