


Editors note: Based on its past behavior, it is likely the mainstream media will be hyping either portions or the entirety of NOAA’s report on “Selected Significant Climate Anomalies and Events,” in the coming days and months. The essay below deconstructs NOAA’s claims for 2023. Climate Realism has previously factually debunked false claims on hurricanes and heat anomalies, similar to what is claimed in NOAA’s report. In fact, contrary to what NOAA implies in its report, 2023 weather for the United States was in one word, normal.
Guest essay by Larry Hamlin
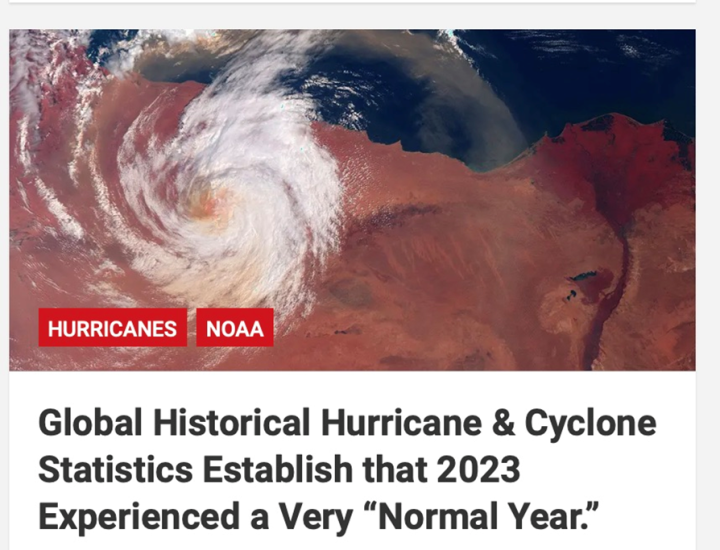
NOAA concocted an array of “Selected Significant Climate Anomalies and Events” for year 2023 that are shown below as prominently featured in their Annual 2023 Global Climate Report.
Of the 25 highlighted entries on NOAA’s “Selected Significant Climate Events” diagram (map seen above) 13 are related to cyclone and hurricane events across the various oceans of the Northern and Southern hemispheres that occurred during the year 2023.
These 13 highlighted isolated events suggest that 2023 experienced many extreme weather hurricane and cyclone events that will no doubt be hyped by climate alarmists with flawed claims of “extreme hurricane and cyclone climate events” having occurred in year 2023.
However, the context of these highlighted events fails to provide a complete and comprehensive global history of the cyclone and hurricane tropical events for the year 2023 with these highlighted events grossly misrepresenting the totality of the year 2023 cyclone and hurricane outcomes across the global oceans.
A prior WUWT article shown below demonstrates that these NOAA highlighted cyclone and hurricane “events” completely misrepresent the very “normal” global hurricane and cyclone year 2023 outcome.
The conclusion of this WUWT article notes:
Unlike the NOAA year 2023 concocted and prominently featured “Selected Significant Climate Events” diagram which falsely hypes the extent of the year 2023 global hurricane and cyclone season outcomes the data from the Colorado State University Tropical Meteorology Project clearly establishes that the year 2023 was a very unremarkable and “normal” year for cyclones and hurricanes across the globe.
Climate alarmist claims that hype the year 2023 hurricane and cyclone season as being an “extreme weather outcome” are absurd and incompetent as is NOAA’s “Selected Significant Climate Events” hurricane diagram portrayal.
Equally disturbing in the NOAA prominently feature “Selected Significant Climate Events” diagram are the highlights noted for both the Arctic and Antarctic global regions.
Instead of identifying the significant 8 yearlong (2016 to 2023) and 17 yearlong (2007 to 2023) inclusive periods of downward temperature anomaly trends respectively for these regions, NOAA hypes sea ice extent issues that are unaddressed in its report.
The reality of the sea ice extent issues for the arctic and Antarctic regions are addressed here and here.
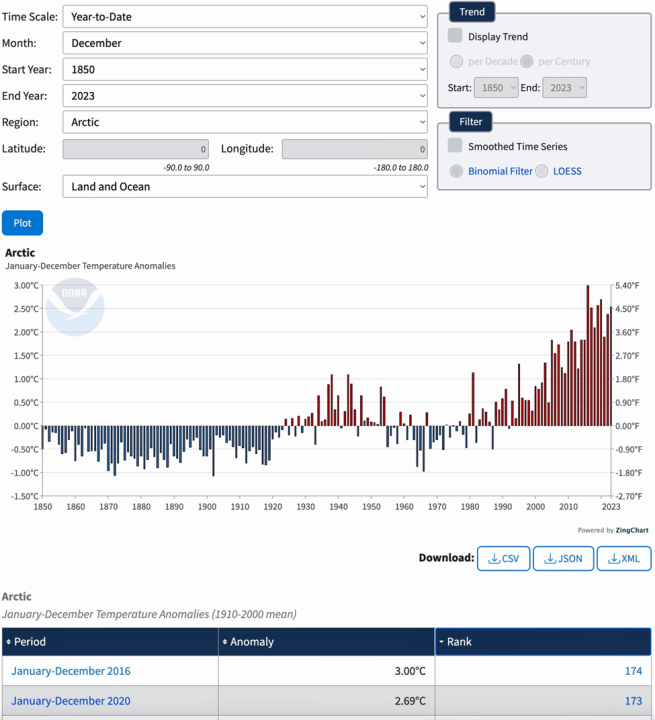
The Arctic Region highest average temperature anomaly was 3.00 degrees C that occurred in year 2016 as shown below from NOAA’s Global Time Series data with a clear downward temperature anomaly trend since 2016 to 2.55 degrees C in 2023 (ignored and concealed by alarmists).
The Arctic’s year 2023 average temperature anomaly was 0.45 degrees C below its prior highest average temperature anomaly year of 2016.
The Antarctic Region highest average temperature anomaly was 0.65 degrees C that occurred in 2007 as shown below from NOAA’s Global Times Series data which clearly shows a downward temperature anomaly trend since year 2007 (ignored and concealed alarmists) .
The Antarctic’s year 2023 average temperature anomaly was 0.50 degrees C below its prior highest average temperature anomaly year of 2007 at 0.15 degrees C.

The Arctic and Antarctic global regional year 2023 long term significant downward temperature anomaly trends of 0.45 degrees C and 0.50 degrees C respectively were ignored in the “Selected Significant Climate Anomalies” diagram while the year 2023 North America and Europe global regional increase and decrease anomaly outcomes of 0.02 and 0.01 degrees C respectively are highlighted as being “Selected Significant Climate Anomalies” merit worthy.
Additionally, NOAA’s prominently featured diagram fails to highlight the largest temperature anomaly change of all 16 global regions with that being the reduction of 0.8 degrees C for the East N Pacific region (over a 9 year inclusive period of 2015 to 2023) as shown below.
Rather than address this large year 2023 average temperature anomaly reduction NOAA’s “Selected” diagram highlight for the East N Pacific global region is adorned with a flawed claim that Hurricane Dora exacerbated the fire in Lahaina with that flawed assessment addressed in more detail here.

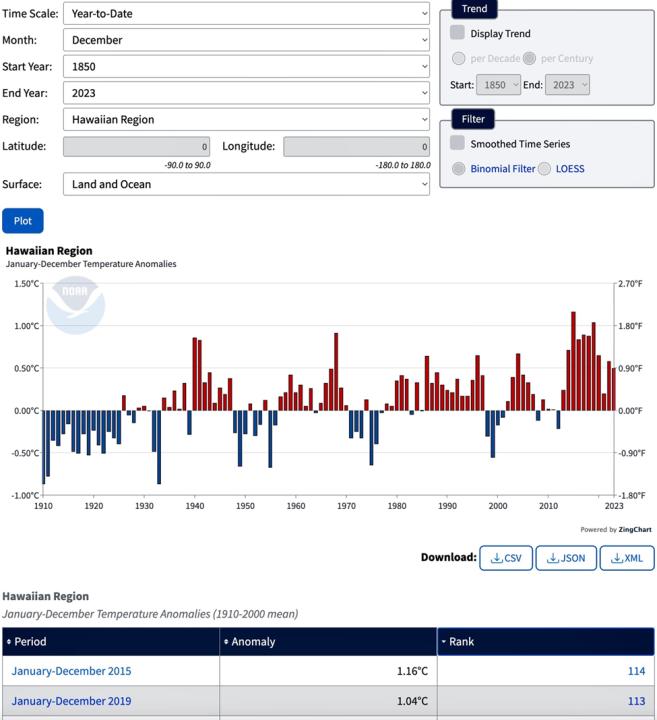
Also, the Hawaiian global region large year 2023 average temperature anomaly reduction of 0.66 degrees C is unaddressed in the NOAA’s “Selected” highlighted diagram. This large reduction (over a 9 year inclusive period) of 0.66 degrees C from 2015 is shown below.
NOAA’s year 2023 average temperature anomaly data for its 16 global regions had 4 global regions which had by far the largest incremental changes from their prior record high average temperature anomaly values (all of them reductions) with these regions being:
Arctic – a reduction of 0.45 degrees C from year 2016
Antarctic – a reduction of 0.5 degrees C from year 2007
Hawaiian – a reduction of 0.66 degrees from 2015
East N Pacific – a reduction of 0.8 degrees C from 2015
Yet none of these significantly largest by far year 2023 average temperature anomaly reductions is addressed in the prominent NOAA’s “Selected Significant Climate Anomalies and Events” diagram for any of these regions while upward average temperature anomaly changes as small as 0.02 degrees C (North America) are highlighted.
The NOAA “Selected Significant Climate Anomalies and Events” diagram misrepresents many significant global anomalies and events for year 2023.


Tooally biased NOAA report serves only NOAA members and nobody else! This is totally false information about climate science or even climate change as the changes were lower and are unreported! The credibility of NOAA like the CDC Disease Claims are perfect examples of why government is only out serve themselves a nd doing the rest of us a disservice! Thanks to climate realism in providing a rebuttal to this article!