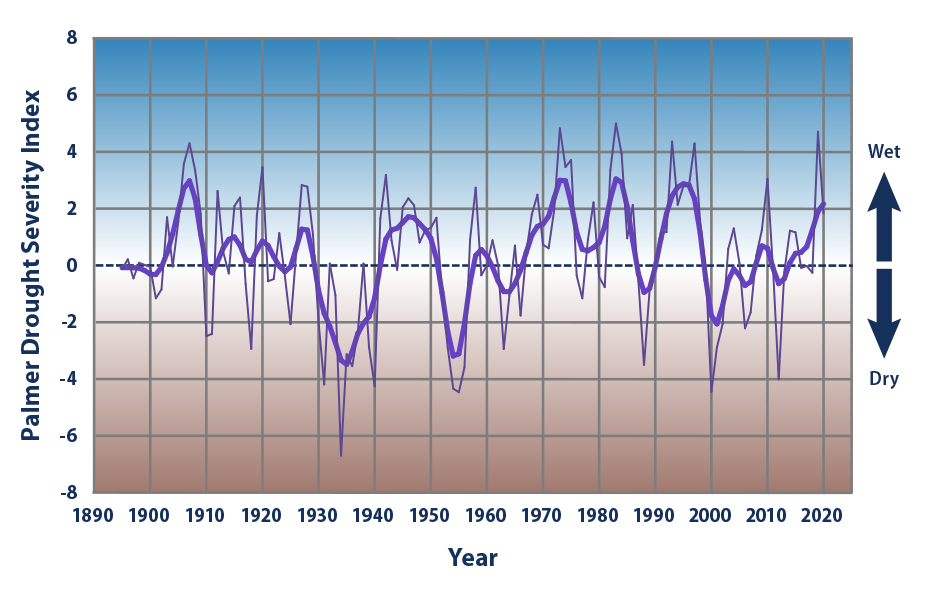
The U.S. Environmental Protection Agency (EPA) brought back its Climate Change Indicator’s platform last week. The agency’s post, titled “Climate Change Indicators: Drought,” shows there is no cause for alarm that climate change is increasing drought. The data cited and graphed by EPA shows no trend towards greater numbers of droughts or droughts of greater severity. They say,
“Average drought conditions across the nation have varied over time,” writes EPA. “The 1930s and 1950s saw the most widespread droughts, while the last 50 years have generally been wetter than average [see the figure below]. Over the entire period … the overall trend has been toward wetter conditions.”
EPA’s drought climate change indicator confirms what other sources of data have shown. As reported in Climate at a Glance: Drought, for example, the United Nations Intergovernmental Panel on Climate Change (IPCC) reports with “high confidence” that precipitation has increased over mid-latitude land areas of the Northern Hemisphere (including the United States) during the past 70 years. IPCC also has “low confidence” about any negative precipitation trends occurring globally.
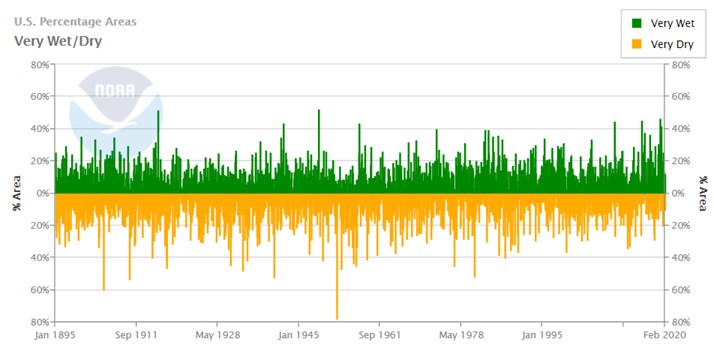
Moreover, the U.S. National Oceanic and Atmospheric Administration reports America is currently is undergoing its longest period in recorded history with less than 40 percent of the country experiencing “very dry” conditions. Also, the United States in 2017 – and then again in 2019 – registered its smallest percentage of land area experiencing drought.
Because drought is a primary climate component that would affect wildfires, it is not surprising to find real-world data show the number of wildfires and acres burned have fallen in recent decades, as well.
EPA’s Climate Change Indicators document discussing drought examines the ups and downs in dryness in different locations in different years across the United States. The only conclusion one can draw from the document and the data about drought in the United States is that the modest warming of the past 150 years has produced no measurable change in the incidences or severity of drought.