Guest Post by William Balgord
The US Environmental Protection Agency publishes information in graphical form (see below) purporting to show a steady increase in records relating to heat waves as having occurred from 1960 to present. But the untold story is what happened during earlier portions of the 20th Century that preceded that date. EPA’s graphs mislead the reader into believing that a calamitous rise in temperature may be about to unfold. It is untrue.
Of the 50 all-time high temperature records for the individual U.S. states, 32 (64%) were set before 1950 and 70 % before 1955. The U.S. Weather Bureau was created in 1890. The all-time national record high, 134 deg. F, was set in Death Valley, California, in 1913, one hundred and nine years ago!
The following graph, from the federal Environmental Protection Agency (EPA), shows heat spikes from 1895 until 2015.
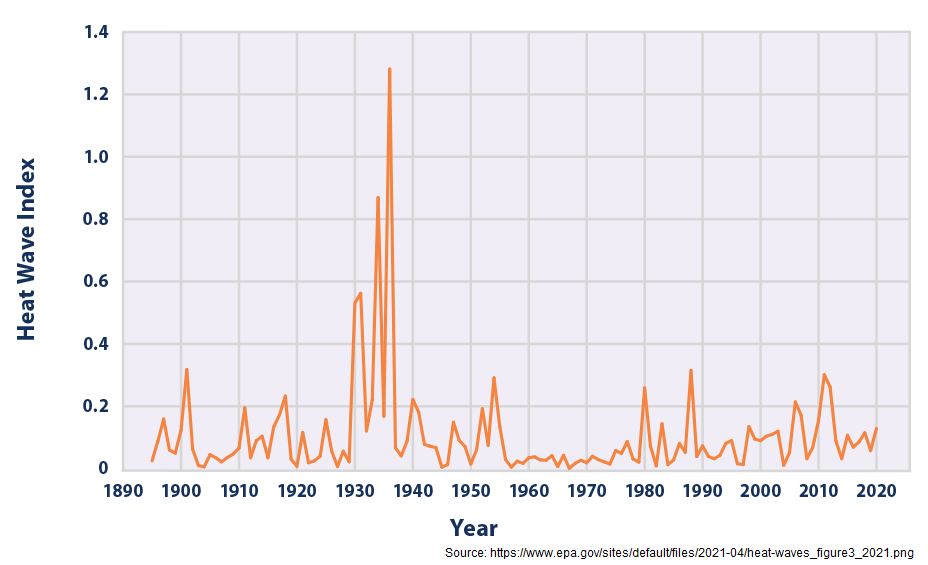
The decade of the 1930s stands out like a giant’s “sore thumb” among all other decades for the number and duration of the heat waves that produced the respective states’ all-time record temperatures.
In the 132-year span since the National Weather Service was created, 1936 stands out like no other. It owns 14 of the all-time records. In spite of EPA’s penchant for force-fitting more recent heat waves into a mold hoping to validate its dodgy theory of human-caused climate-change, the foot does not fit the shoe. We’ll take a closer look at that in a moment.
But which came first, the chicken or the egg? Does a heat wave precede a drought, or vice versa? Actually, they tend to work together.
Consider the 1930s decade that led to a majority of the still-standing records and the evolution of the Great Dust Bowl. By 1930 excessively high temperatures began to appear across the southern plains. Severe drought struck portions of Texas and Oklahoma. Louisiana and Mississippi each established their all-time high temperatures that summer.
The succeeding years were very hot, with only a brief respite in 1933, when welcome rains relieved some of the driest affected areas. Then followed 1934. By some criteria it remains the hottest year in the entire US record that currently extends through 2021.
Drought again relented a bit in 1935. Then followed 1936. Without doubt it was the worst of the worst years for excessively high temperatures. Some residents in La Crosse, Wisconsin, temporarily moved from the city to spend time with relatives out on the farm. Others living in downtown apartments retreated upstairs onto flat rooftops and spent the nights on cots to escape the inferno.
Residences had no air conditioning during the 1930s. Scarce AC units were reserved for a few upscale restaurants and movie theaters.
Now to the EPA’s reporting on the severity of the current and recent heat waves. Here is EPA’s heat-wave graph with the headline that introduces it:
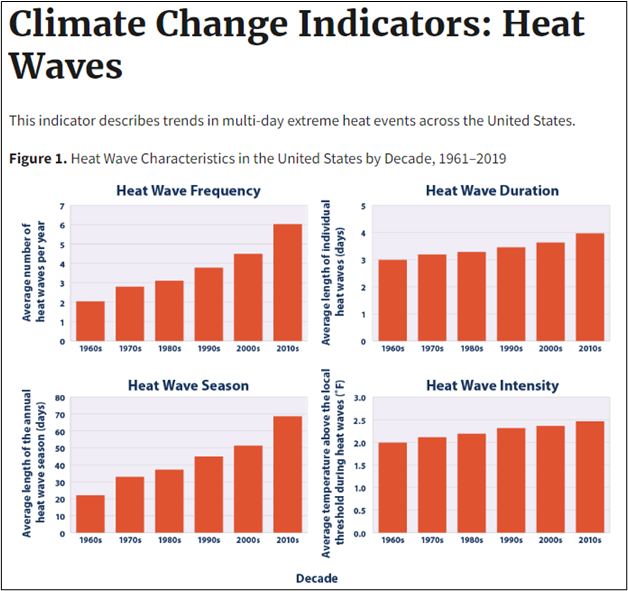
What is wrong with this picture? As already stated, the US weather record extends back to 1890. The most severe heat and drought related weather had already occurred before 1960. These graphs are all a day late and a dollar short.
The apparent trends in the bar graphs above are an EPA figment. If the decade of the 1930s had been included, the existing bars would shrink to comparative insignificance. The decade from the 1960s and into the 1970s was a relatively cooler period, so that by truncating the earlier portion of the time series, EPA has painted a false picture that implies a continuous warming trend that has never existed if viewed on the scale of the entire 20th Century.
The reader may be curious how nature can produce coupled twin events, a prolonged heat wave and a longer persistent drought.
On a regional scale, dry periods often will follow the development of a coupled circulation pattern in the equatorial Pacific Ocean, known to climatologists as the El Niño Southern Oscillation or ENSO. El Niños develop on the back of prevailing westerly winds that drive warm surface water from the central Pacific Ocean against the coastline of South America (Peru and Chile). The results of this large-scale event were sometimes observed by Peruvian sardine fishermen around Christmas time, and they called it “El Niño,” the little boy. But there is a counter event known as “La Niña”, the little girl, that sets in when persistent easterly winds push warm water back toward the central Pacific. As surface water is displaced westward, it is replenished with upwelling, nutrient-laden cold water that greatly favors the sardine fishery.
The upshot is that whenever a La Niña pattern is in place, much less water vapor evaporates from eastern regions of the Pacific Ocean, resulting in less precipitation falling over Central and North America. Persistent La Niñas, like the one now in its third year, tend to produce dry conditions in drought-prone regions of the western United States. It is far more likely that the ENSO pattern is driving the current dryness and accompanying hot weather than that carbon dioxide emissions from fossil fuels are.
But heat waves and drought go hand in hand. Once land and forest reach a certain level of dryness, evaporative cooling diminishes. Then temperatures are free to rise and fall to limits of the diurnal cycle of night and day and the synoptic weather patterns that may cause blocking of a stagnant high-pressure area. The domes of dense, drier air may then slowly move eastward, allowing the maximum daily temperature to continue to rise until its final passage.
During the Dust Bowl, tilled soil that had been planted to wheat and other grains dried out so thoroughly that the crops shriveled to nothing, leaving bare soil exposed to the winds. Ablation then carried away billions of acre feet of what had been fertile soil across the eastern states and as far as the Atlantic Ocean.
In the absence of beneficial rainfall, the process went on unabated until the arrival of autumn and winter. By then there was too little precipitation to abate the same processes from resuming and going forward during the next summer. Historical revisionism likes to blame the Dust Bowl on poor farming practices. But given the magnitude of the altered 1930s climate, it is not clear that much the same result wouldn’t have proceeded with incipient desertification during that full decade of heat and dryness.
Current temperatures being recorded at locations where new daily records are being notched (no report of a new state record as yet in 2022) are likely accurate in themselves. What is less certain is whether any monitoring station reporting a new record is in proper compliance with NOAA’s strict guidelines for operating an official temperature measuring station.
A team of observers headed by career meteorologist Anthony Watts, under auspices of the Heartland Institute, has just completed a year-long study of the NOAA weather stations that feed data to the US climatological network.
The prognosis is not good. A full 96% of stations investigated failed to meet NOAA’s own siting standards. Most measurement devices were placed uncomfortably short of the specified minimum 100-foot separation from an adjoining building or structure. Many others are placed over concrete or other heat-absorbing solid materials instead of grassy turf or soil as spelled out in NOAA’s own manuals. Others were even in the immediate vicinity of heat-generating devices such as air conditioners, parking lots, or airport runways and taxiing areas.
The inescapable conclusion is that a vast majority of the monitoring sites are generating data contaminated with a positive bias, adding to the false notion of dangerous warming. The recorded temperatures are higher than if they were being taken from a site not influenced by extraneous heat sources.
So it is at least highly likely that more than a few of the new daily records being bandied about this summer could be artifacts of their immediate environment and do not necessarily represent a true temperature record for the areas of concern. In any case, they don’t yet begin to challenge the temperatures of the 1930s for the highest on record.
This article was original published by the Cornwall Alliance and is republished with the express permission of its author and the Cornwall Alliance.
William D. Balgord, Ph.D. (geochemistry) heads Environmental & Resources Technology, Inc. in Middleton, WI and Fort Pierce, FL, and is a Contributing Writer for The Cornwall Alliance for the Stewardship of Creation.