


Phys.org reposted a press release from NASA’s Jet Propulsion Laboratory (JPL), titled “Rising sea level could exceed estimates for US coasts, NASA study finds,” which claims climate change is causing larger than expected sea level rise. This claim is not supported by a comprehensive reading of the available evidence
The JPL study referenced in its press release was published in Nature Communications, Earth & Environment.
“New results show average sea level rise approaching the 1-foot mark for most coastlines of the contiguous U.S. by 2050. The Gulf Coast and Southeast will see the most change,” reports the subheading of the Phys.org article.
A number of federal agencies contributed to the report, including NASA, the National Oceanic and Atmospheric Administration, and the U.S. Geological Survey. After examining 28 years of satellite data, they estimated, seas could rise between 10 to 18 inches, depending upon the coastline, over the next 30 years.
The study makes three significant mistakes. First, the accelerated rate of sea level rise (SLR) the researchers perceived in recent years appears to be an artifact of switching between different satellites during the period of measurement, not an increase in the rate of rise.
As discussed in Climate Realism, sea-level data reported from recently launched satellites indicate seas are rising approximately of 3.4 mm/year. By contrast, tidal gauge stations have recorded a rise of approximately 1 to 2 mm annually, a rate which is little changed over the century or so for which we have adequate records. The data the newest set of satellites produced does not correspond to the data recorded by earlier satellites, which were largely consistent with tide gauge data.
The most recent satellites record significantly higher rates of sea-level rate of rise than the earlier satellites. The earlier satellite measurements agree quite well, but they show a much lower trend than the most recent satellites. Neither set of the satellite record shows any accelerating trend. Whence the difference? It seems likely that the researchers involved simply combined the two dissimilar data sets, plotted a new trend showing acceleration, which is either a mistake, evidence of incompetence, or worse, deliberately misleading.
As Willis Eschenbach explains:
[R]egarding the question of whether there is acceleration shown in that spliced satellite record, I’ll say the three most important words that any scientist can ever say:
We. Don’t. Know.
We don’t know for a few reasons. The first is that it’s a spliced dataset, and the changes in the trend line all occur at and after the splices. Makes a man suspicious, particularly given the differences in the initial individual datasets. (See Figure 1.)
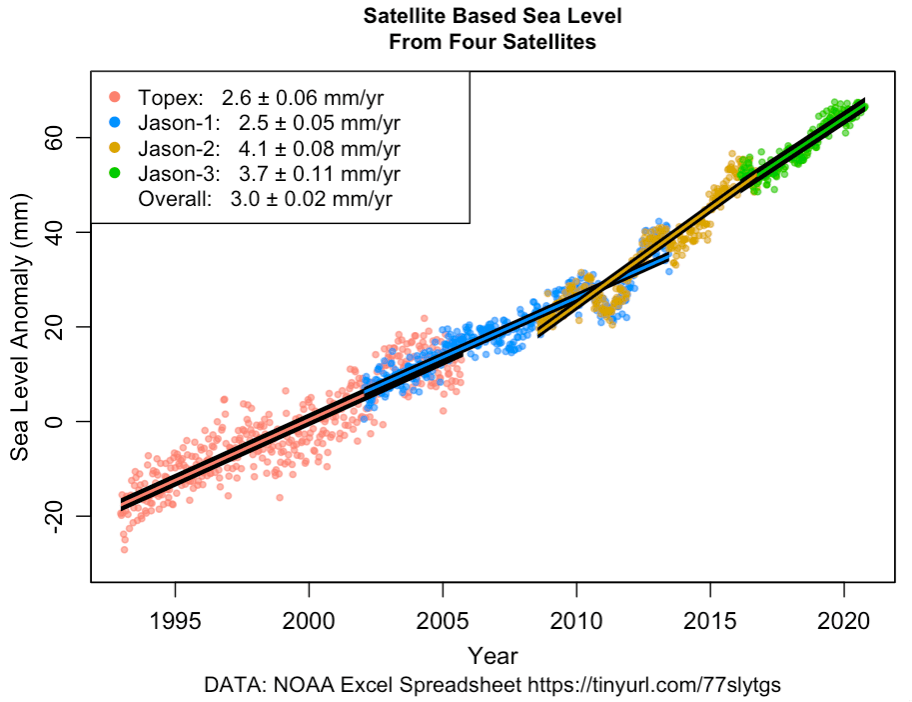
Figure1: NOAA sea level data, showing the trend of each of the full individual satellite records. SOURCE: NOAA Excel Spreadsheet
Essentially, we have data measured by four different satellites, in four different orbits, each with different sensing equipment. It is no surprise that there would be differences in the data that isn’t part of what was to be measured.
More to the point, to get the 10 to 18 inch sea level rise JPL warns of by 2050, the rate of sea level rise would have to accelerate significantly. It’s 2022, 28 years to 2050. At 3.4 mm/year, today’s satellite SLR rate, by 2050 the expected rate of rise would be 95.2mm or about 3.75 inches . Sea level rise would have to accelerate three times the rate today to match the low end estimate of 10 inches of rise by 2050, and by nearly five times to rise by 18 inches.
Yet there there is no evidence the rate of sea level rise is accelerating at all, much less by three to five times the current rate.
Eschenbach continues:
The second is that the record is only 27 years long, so we really don’t have enough data to draw many conclusions. This is particularly true since the variations from a straight line are quite small.
Third, the rise was right along the linear trend line up until 2005. So, there was no acceleration before that time. Then the rate of rise started decreasing around 2005 … deceleration rather than acceleration? Why? And then, according to the spliced dataset, it started rising faster around 2011. Again, why? Assuredly those three, first a straight line, then deceleration, then acceleration, are unlikely to be caused by a monotonic rise in CO2. Nor do they conform with any expected pattern of acceleration.
What else did JPL miss? The fact that some of the cities whose data were used have a series problem with subsidence – a sinking of the land, which creates a false impression of sea level rise. The peer-reviewed study “Local land subsidence in Miami Beach (FL) and Norfolk (VA) and its contribution to flooding hazard in coastal communities along the U.S. Atlantic coast,” notes subsidence is a serious problem with Norfolk, VA – interestingly, JPL used a picture of Norfolk flooding is its press release, seen in the featured image for this story and provided by the city of Norfolk.
What can explain the sad state of affairs resulting from scientists, some considered among the top in their field, missing simple things like combing discontinuous records to produce artificial trends in the sea level rise data? Or the fact that some widely acknowledged factors, like land subsidence, are not accounted for in their projections of rising seas?
Arguably, in the rush to jump on the “climate change crisis” bandwagon, JPL ignored problems with their spliced together data set, and failed to consider the full range of factors, other than actually rising seas, which could be contributing to measured sea level rise. By their slipshod work, JPL did the public a disservice and made fools of themselves.


Bravo! Perhaps a short bio on Jack Parsons, whom JPL is named for would further drive the point home. He had no engineering training, and claimed to get his diagrams for rocket science from extraterrestrial beings which many believe are spiritually dark forces. JPL is just another alphabet agency serving the corrupt federal government.
…but they supported the political narrative of those who pay their salaries.
Well done as always, my friend. Clear, concise.
w.
About Sea Level Rise:
A rising sea level would increase the Inertia of the Earth Crust.
More Land Ice is near the spin axis of the rotating earth crust while much more ocean is near the equator where sea level rise would significantly increase the inertia of the spinning earth crust.
Conservation of Momentum would slow the Rotation Rate of the Earth Crust. The Atomic Clocks were put in place to measure Time Extremely Accurately, in 1972. More Leap Seconds would need to be added more frequently, but Less Leap Seconds have been added to the time every decade since 1972. The last leap second was added in 2016 and none expected to be added.
This is valid Proof that Sea Level is Lower Now than it was in 1972!
Sea Level has Fallen for Fifty Years, yet they say it has risen and the rise rate is accelerating. If sea level Ever Rises, Added Leap Seconds will be an Immediate Indicator.
Since there is Absolute Proof that they have lied about Sea Level Rise, it clearly follows that the rest of the Climate Alarmism is Also Lies!
So, “How well do state-of-the-art climate models simulate sea level?”
So, “How well do state-of-the-art satellite data match sea level?”
As Willis Eschenbach explains:
We. Don’t. Know.
I disagree, since Length of Day has decreased for 50 years, their published sea levels do not even go in the right direction!
If you take ice away from polar regions, reducing mass close to the spin axis of earth and increase sea level where water around the equator would increase mass of ocean further from the spin axis, the Length of Day would get longer and more and more leap seconds would be required to be added more frequently. The Opposite has happened since 1972.
Watch for added leap seconds and then, and only then, worry about sea level rise.
Warmer Ocean currents in Polar Regions are necessary for evaporation and snowfall in Polar Regions to maintain the sequestered ice on land in polar regions, ice core records from Greenland and Antarctica show that ice accumulations are only large when temperatures are warmer. In colder periods the ice is flowing and depleting due to lack of snowfall.
This Modern Warmer Time is Necessary to rebuild polar ice and lower sea level, LOD proves this to be happening, less leap seconds added since 1972 shows that water has been removed from the oceans and placed closer to the spin axis as polar ice and other ice closer to the spin axis.
Interesting in that the data presented by NOAA in 2021 of sea level rise and fall (Tides & Currents) in their selected cities/areas throughout the world, averaged out to 1.36 mm/year! IF NOAA’s data is correct, then we’ll have a long wait for the mean global range to reach the one foot mark. At the current rate, 2050 simple will not cut it!