In a recent article published by E&E News Climate Wire, reporter Scott Waldman claims Reno, Nevada is the fastest warming city in the United States. In this single article, titled “Nation’s fastest-warming city could decide Senate control,” Waldman makes the mistake of conflating climate change, the Urban Heat Island effect (UHI), and politics.
Waldman writes:
“More than almost any other city, Reno’s fate is intertwined with climate politics in Washington. It’s the fastest-warming city in the United States, and is 10.9 degrees Fahrenheit warmer than it was in 1970, according to a July report from Climate Central. (Las Vegas places second, with 5.6 degrees of warming.)”
There’s some truth in that claim about the warmer temperatures since 1970, but the claim of it being “intertwined with climate” is absolutely false. Multiple lines of evidence and data analysis proves it.
First, let’s look at the claim made by Climate Central, the global warming advocacy group Waldman used for his source. Climate Central claims:
-
-
Summer warming was greatest in the western and southwestern U.S. The three greatest increases in summer average temperatures since 1970 were in Reno, Nev. (10.9°F), Las Vegas, Nev. (5.8°F), and Boise, Idaho (5.6°F).
-
Those cities temperatures have risen dramatically. However, Climate Central completely failed when they tried to attribute the increasing summer temperatures to greenhouse gas increases, saying:
The heat is on. As planet-warming gases from fossil-fuel burning increase global average temperatures, we’re experiencing more extreme heat events. Extreme heat is most apparent in the summer since it’s the hottest time of year.
Waldman and Climate Central blamed greenhouse gases from fossil fuels for the rise in temperatures, without any research or undertaking an analysis concerning the true factors responsible for the dramatic warming in those cities. The UHI is mostly to blame.
As far back as 2008, I discovered that the UHI had compromised Reno’s ground based temperature readings, through a hands-on experiment to determine the strength of UHI on summer nights. Using a calibrated digital thermometer, I drove transects across Reno back and forth at night while measuring air temperature. A clear result emerged from that experiment. My experiment worked so well that there is now a citizen science based program to do driving temperature measurement transects in major cites in the USA.
From the data measured, it became clear that a huge UHI signature existed near downtown and airport. The temperature data used to claim that Reno is the “fastest-warming city in the United States” comes from the automated weather sensor, known as an ASOS, at the city’s airport.
Even the local National Weather Service (NWS) office in Reno acknowledges the problem. They tried to move the airport temperature sensor to a cooler location away from the city generated UHI heat bubble, further south, but were overruled by the Federal Aviation Administration (FAA) who said the temperatures were not representative of conditions on the runway. In a training manual they produced, they said:
Reno’s busy urban airport has seen the growth of an urban heat bubble on its north end. The corresponding graph of mean annual minimum temperature (average of 365 nighttime minimums each year) has as a consequence been steadily rising. When the new ASOS sensor was installed, the site was moved to the much cooler south end of the runway.
…
When air traffic controllers asked for a location not so close to nearby trees (for better wind readings), the station was moved back.
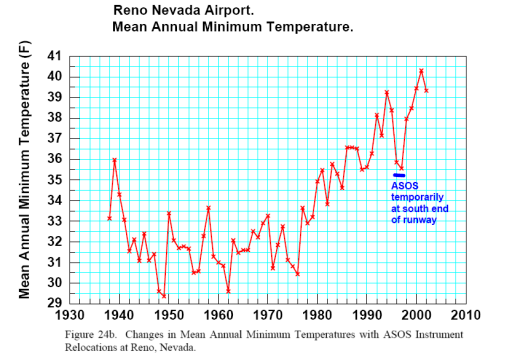
As seen in Figure 2 above (figure24b from the NWS Manual) during the short time the ASOS was moved, cooler temperatures prevailed. Clearly the UHI biases temperatures reported from Reno upward. There was even a peer-reviewed paper written about the issue in which Reno’s airport ASOS sensor moves were shown to cause dramatic shifts in temperature.
Placement near heat sinks and sources, such as tarmac and runways, is one of the most significant problems with temperature data at airports being used to measure climate change. The sensors are placed to give runway conditions for aviation safety – they were never intended for climate use. The data is not fit for that purpose. A 2022 report Corrupted Climate Stations: The Official U.S. Surface Temperature Record Remains Fatally Flawed, found that this problem isn’t just at airports, but at the vast majority of weather stations that are being used to measure temperature.
Further proof that the UHI, not climate change, is driving Reno’s sharply rising temperatures comes from an analysis done by climatologist Roy Spencer, Ph.D. of the University of Alabama at Huntsville, and myself.
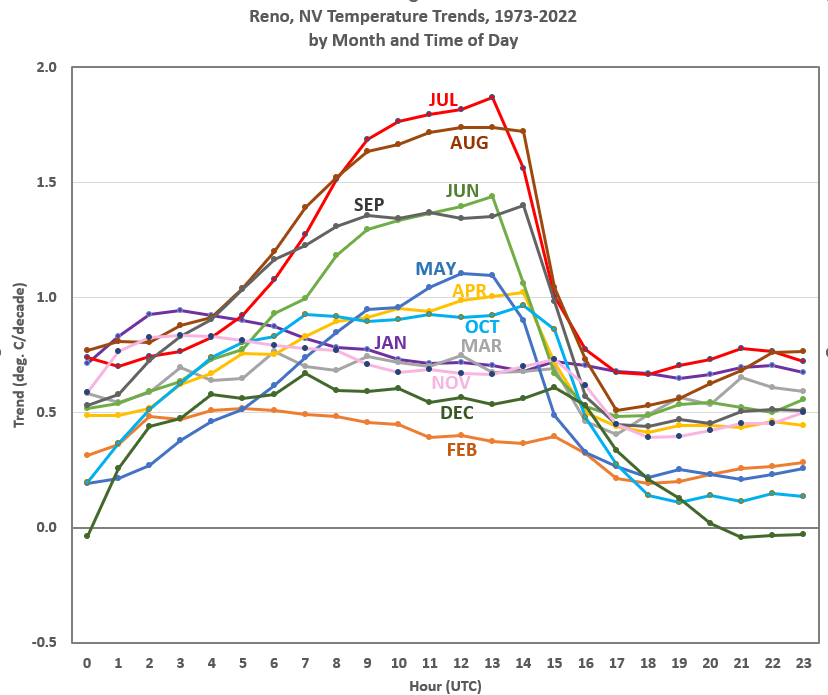
Spencer took all of the available hourly temperature data from NOAA’s Integrated Surface Database (ISD) and performed an extensive hour-by-hour analysis seen in Figure 3 below. What he found disproves any significant climate change link to Reno’s temperatures.
To explain the graph.
- The time on the graph is in UTC (also known as Greenwich Mean Time or GMT) because that’s how the data is stored. For Reno, 6AM (dawn in the summer) corresponds to 14 (UTC).
- The graph shows clearly that there are strong summer warming trends in the months of May, June, July, August, and September overnight that disappear right after dawn.
- Conversely, there are no warming trends overnight in the winter months of November, December, January, and February.
- Climate change, which is scientifically agreed as measured over 30 years, is not time selective on an hourly or monthly basis. What we are seeing in Reno is a local UHI effect on summer nights.
If climate change was driving Reno’s temperatures, the rapid rise in temperatures would also be evident in the winter, but Spencer’s analysis clearly demonstrates that it is absent. It is also absent during the daytime.
Additional support for this finding is found in a study produced by the University of Nevada at Las Vegas, “The Urban Heat Island Effect in Nevada.” The March 2020 study, examined the UHI effect in Reno and Las Vegas, the two biggest cities in the state. They found that the UHI is a big problem in Nevada (emphasis mine):
Cities are warmer than surrounding rural areas because they replace open areas and vegetation with pavement, buildings, and other heat-absorbing infrastructure. This phenomenon is referred to as the “urban heat island” effect. The mean annual air temperature in a city with over 1 million residents can be 1.8 – 5.4°F warmer than surrounding areas during the day and over 20°F warmer at night. The heat island effect has worsened over time; today, cities experience ten more “extreme heat events” on average than they did in the mid-1950s.
UHI is also being driven by waste heat from air-conditioning as detailed in a 2014 study by researchers at Arizona State University, titled “Excess heat from air conditioners causes higher nighttime temperatures.” They wrote, “…during the night, heat emitted from air conditioning systems increased the mean air temperature by more than 1 degree Celsius (almost 2 degrees Fahrenheit) for some urban locations,”
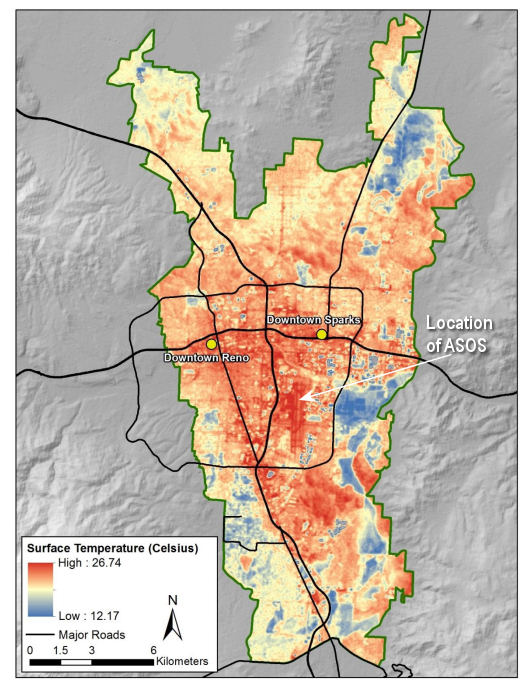
Finally, another peer-reviewed study published by the University of Nevada at Reno titled Determining Heat Island Response to Varying Land Cover Changes Between 2004 and 2017 Within the City of Reno, Nevada has a map of satellite derived temperature combined with Landsat imagery. I have annotated it to show the placement of the airport ASOS sensor in Figure 4. It clearly shows the sensor being in the middle of the runways, and by the colors, the warmest part of Reno.
Waldman and Climate Central failed to examine local causes that are clearly driving the dramatic temperature rise in Reno, instead simply choosing the lazy path of uncritically attributing Reno’s rising temperatures to human induced climate change. Tellingly, they cite no evidence for this claim. How could they? There is none.
Waldman and Climate Central chose advocacy over honest journalism and following the science. They should be ashamed of their lack of professionalism.