Guest Post By Roy W. Spencer, Ph. D.
*Editor’s Note: Dr. Roy Spencer analyzes the impact of the Urban Heat Island effect on major U.S. cities, especially recent alleged record warmth in Phoenix, Arizona. Climate Realism also covered the well-recorded UHI problem for Phoenix in particular, where the downtown temperature stations can measure 15°F hotter at night than surrounding areas.
Ah, the 1960s. Even in 1966, before global warming was a thing, The Lovin’ Spoonful was singing about (among other things) the unusual heat of the inner city.
In fact, the heat caused by urban environments was discussed way back in 1833 (190 years ago!) by Luke Howard (The Climate of London) who was the first to document the urban heat island (UHI) effect.
Today, virtually anyone who routinely travels between cities and rural areas has observed the localized warmth that cities produce.
It is important to emphasize that the UHI effect, along with “record warm” temperatures, would exist even if there was no “global warming”. This is because cities have grown substantially in the last 100+ years, replacing the native landscape with high heat capacity surfaces like buildings, pavement, and sources of waste heat. This leads to UHI warmth of up to 10 deg. F or more, mostly at night.
Yet, we are routinely told through media reports that the latest record warmth recorded in some of our cities shows how serious the global warming problem has become. For example, as shown in this graphic from the Miami Herald, the summer of 2023 experienced some record warmth in cities across the South.
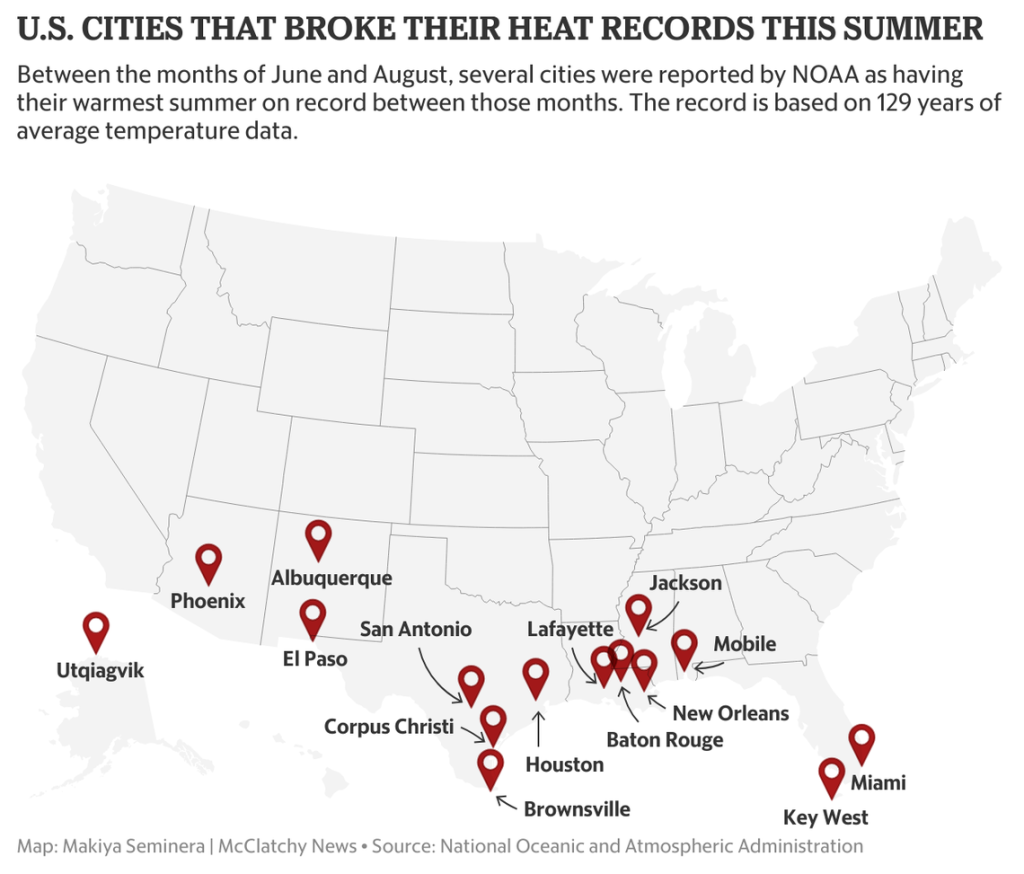
Of course, conflating the urban heat island with global warming is a necessary component of such reporting, as the news report dutifully adds,
“Prominent scientific institutions around the globe including the National Oceanic and Atmospheric Administration agree that the warming is caused mainly by human-caused greenhouse gas emissions, NASA said.”
See how that works? A city has record warmth, so it must be due to global warming caused by burning fossil fuels. To be fair, not all the blame is always placed at the feet of Climate Change. For example, this 2014 article specifically discussed the role of the urban heat island in Phoenix weather.
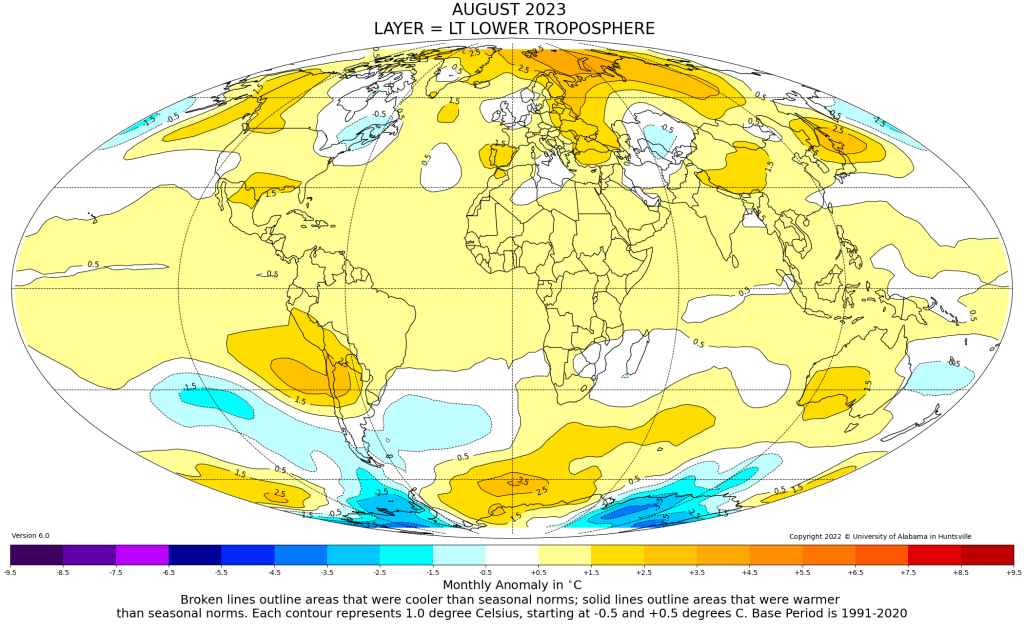
Now, it is true that the southern U.S. had an unusually hot summer. Even our (UAH) satellite-based temperature product for the lower atmosphere showed this warmth in August:
In my last blog post, I showed our urbanization-adjusted average summer temperatures (based upon NOAA homogenized GHCN surface air temperatures) across all available stations in the Lower 48 states, and the result was that summer of 2023 was the 13th warmest (see Fig. 3 here) since records began (but with very few stations) in 1895.
But what role does climate change have in these records at selected cities? Most of what we hear through the media comes from urban reporting stations, or at least airports serving major urban areas.
The Summer of 2023: Phoenix versus Surrounding Stations
If the record hot summer in Phoenix is due to global warming, then it should show up at weather stations surrounding Phoenix, right? As part of our research project where we are quantifying the average urban heat island effect and its growth over time as a function of population density, I looked at the official NOAA GHCN monthly surface temperature data at Phoenix Sky Harbor Airport (red curve in the following graph) versus at all rural stations (0 to 100 persons per sq. km) within 10 to 100 km of Phoenix (blue curve). I also applied a small urbanization adjustment correction at the rural (or nearly-rural) stations based upon their individual histories of population growth.
The result? The summer of 2023 was only the 11th warmest summer on record.
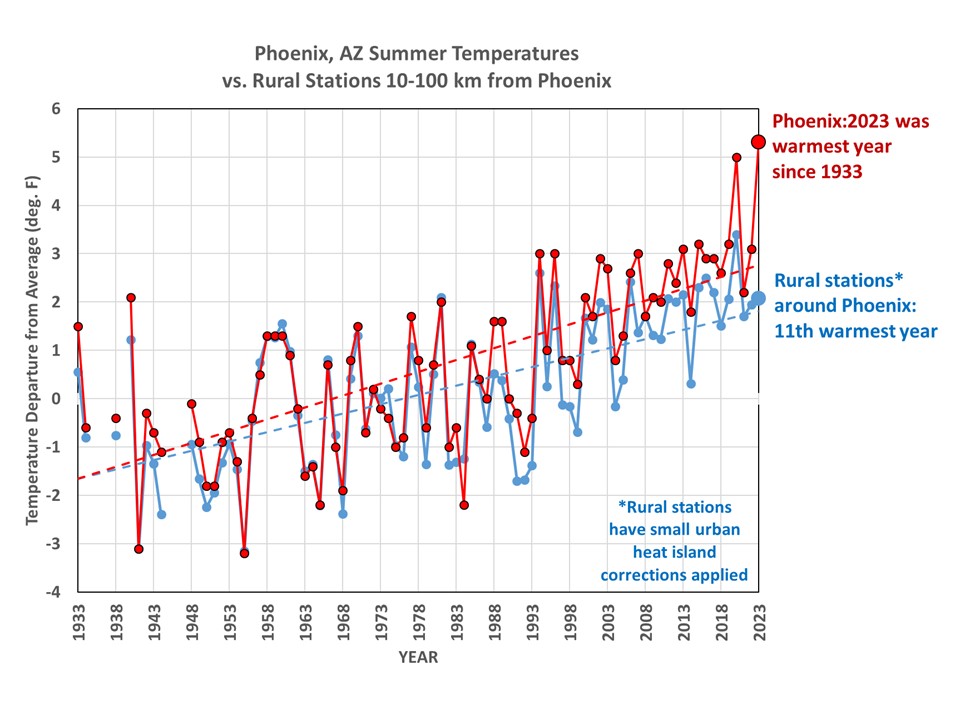
So, we see that the urban heat island effect was the dominant cause of the summer of 2023 being a record warm year in Phoenix. The “vote” from surrounding rural and nearly-rural stations was that it was only the 11th warmest year. As a side note, the difference between the red and blue curves indicate a jump in Phoenix Sky Harbor temperatures of about 0.7 deg. F around 1988. This could be due to a weather station move, but I have not investigated it.
“But”, you might protest, “even the rural stations still show a strong warming trend”. Well, that is partly because I have used only “homogenized” temperature data, which NOAA has already adjusted to some extent leading to all nearby station temperature trends being more or less equal to one another. I’m still trying to determine if I can use the “raw” data to make such comparisons, since there are other data adjustments made in NOAA’s homogenization of the data that I’m not privy to.
Another thing to notice is that media reports will repeat NOAA’s claim that these new high temperature records are based upon data extending back to 1895. In general, this is not true. Most of these station records don’t go back nearly that far. For the Phoenix Sky Harbor location, the data started in 1933. A few of the other “record hot cities” start dates I’ve looked at so far are Miami, FL (started in 1948), Houston, TX (1931), and Mobile, AL (1948).
The bottom line is that there are unsupportable conclusions being drawn about the supposed role of climate change in record high temperatures being reported at some cities. Cities are hotter than their rural surroundings, and increasingly so, with or without climate change.
Originally posted at Dr. Roy Spencer’s blog, here, reposted with permission.