A new study published in the journal Geophysical Research Letters examining satellite instruments’ measurements of how Earth’s energy budget has changed, is being falsely portrayed by the media as showing human greenhouse gas emissions are trapping an record amount of heat. The data discussed in the article, titled “Satellite and Ocean Data Reveal Marked Increase in Earth’s Heating Rate”, does show the amount of heat “trapped” recently has increased, but the alarming implications of that fact are being misportrayed by the mainstream media.
For example, one media story from the Guardian trumpeted:

But like many climate stories in the media today, when you peel back the layers of hype and fear-mongering, you’re left with something that isn’t alarming at all.
First, the period they study is rather limited, 2005 through 2019, which less than half of the 30 year time span required for a valid climate data set, according to the World Meteorological Organization.
Climatologist Dr. Roy Spencer analyzed the study and reports:
“They also point out that the Pacific Decadal Oscillation (PDO) is responsible for some of what they see in the data, while anthropogenic forcings (and feedbacks from all natural and human-caused forcings) presumably account for the rest.
One of the encouraging results for [the study] is that the rate of increase in the accumulation of radiant energy in the climate system is the same in the satellite observations as it is when computed from in situ data, primarily the Argo float measurements of the upper half of the ocean depths. It should be noted, however, that the absolute value of the imbalance cannot be measured by the CERES satellite instruments…”
In essence, what Dr. Spencer says is the data showing the rate of change is accurate as far as it goes, but the absolute value of the change can’t be accurately measured.
Concerning the media’s coverage of the study, Spencer says:
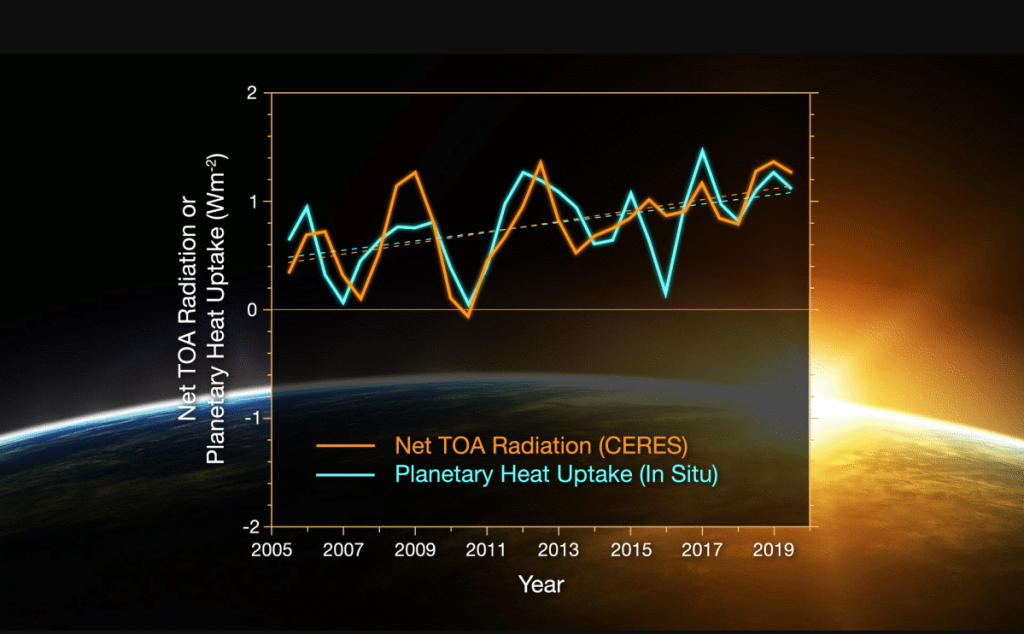
“The main problem I have is with the media reporting of these results. The animated graph in the Verge article shows a planetary energy imbalance of about 0.5 W/m2 in 2005 increasing to about 1.0 W/m2 in 2019.”

“First of all, the 0.5 to 1.0 W/m2 (Watt per square meter) energy imbalance is much smaller than our knowledge of any of the natural energy flows in the climate system. … approximately 1 part in 300. [Emphasis mine]”
“Secondly, since we don’t have good global energy imbalance measurements before this period, there is no justification for the claim, “the magnitude of the increase is unprecedented.” [Emphasis Spencer’s] To expect the natural energy flows in the climate system to stay stable to 1 part in 300 over thousands of years has no scientific basis, and is merely a statement of faith. We have no idea whether such changes have occurred in centuries past.”
“What bothers me is the alarmist language attached to (1) such a tiny number, and (2) the likelihood that no one will bother to mention the authors attribute part of the change to a natural climate cycle, the PDO.”
Indeed, the small amount of energy change of 0.5 to 1.0 watts per square meter from 2005 to 2019 cited in this study is even lower than the average change of sunlight we receive during an 11 year solar cycle.
NASA says,
“Overall, TSI varies by approximately 0.1 percent—or about 2 watts per square meter between the most and least active part of an 11-year solar cycle.” [Emphasis mine]
Data show the amount of sunlight hitting Earth naturally varies by an amount at least DOUBLE that of the energy “imbalance” estimated in this study. Also, one cannot show this imbalance is unprecedented, because no data of this type exists before 2005 to compare it to.
The hype over this study is based on nothing more than the media grabbing a few choice phrases from it and turning them into a misleading, five-alarm fire. We are being told the United States must reduce is carbon dioxide emissions based on a study using data covering a very short time period; a study indicating such a small amount of change that it falls below the natural variance caused by the sun, the biggest driver of earth’s energy budget!
Neither this study, nor the media hype surrounding it, provide evidence the recent increase in the earth’s radiant energy is either due primarily to human causes or is catastrophic. The United States has done more than any other nation to reduce CO2 emissions during time period of of the study.
As a result, the study provides no reason for believing further reductions in America’s greenhouse gas emissions will impact the earths’ energy budget or correct any supposed energy imbalance; an imbalance than hasn’t been established, and that may not exist.


NASA sadly is just another agency that has fallen under the spell of left wing politics. Just look who is in charge at the Goddard Institute for Space Studies (GISS). GISS obtains much of its climate data from the Global Historical Climatology Network (GHCN) of the National Climate Data Centre (NIDC) within the National Oceans and Atmospheric Administration (NOAA).
These people have been fudging the instrument surface temperature data for so long, that data is no longer reliable, which puts into question the credibility of the GISS, GHCN, NIDC and NOAA, and consequently NASA.
I trust what NASA is doing in space. It should stick to space. However, I do not pay any attention to what NASA has to say about Earth’s atmosphere regarding heat and temperature.
I am starting to think that NASA stands for National Alarmist and Spurious Administration
Any real scientist aware of the gas laws would understand that radiative gases do not trap photons. If a radiative molecule is able to accept a photon, it will radiate one within nanoseconds. So much for trapping. (No, it is not ‘reradiating’ the photon, the original is gone, and a new one is emitted’.)
In fact, a radiative gas molecule radiates constantly. If you could see it, it would look like a tiny flashlight. When it radiates, it loses energy and then gains energy from either another incoming photon or from a collision with an inert molecule that is of higher energy. Guess which is more likely…
So-called greenhouse gases help COOL the atmosphere by radiating photons due to collisions with higher energy gases, like nitrogen, oxygen, argon. There are 2400 of those for every gh gas molecule.
Also, the climate is always changing. The only thing it does NOT do is stay steady. Commenting on warming (like the above-mentioned ‘trapping’ is like commenting on a roller coaster, each time it is going up. Silence, of course, when it is going down…
We are apparently still warming up from the Little Ice Age. To determine if their satellite data is truly “unprecedented”, they need to compare it to satellite data taken from the warmup from the Dark Ages Cooling Period, or some other cooling period during the Holocene, or even the warm up from the coldest part of the last ice age. Apparently the required satellite data is hard to come by.
Might there also be a contribution from the 0.56 W m-2 dec-1 decrease in surface radiant exitance due to “loss of heat” (their words), implying that the surface cooled? You betcha.
https://i.imgur.com/FnUomVJ.png
I know, I know… the kooks will claim “But… but… but the planet is warming!”… to which I reply, that study shows a decrease in TOA contribution to radiative flux from surface skin temperature… please explain exactly how the planet can warm as you claim, yet emit less radiation, when surface radiation centered at 10.073 µm has a TOA (Top Of Atmosphere, that altitude at which the atmosphere effectively becomes transparent to any given wavelength of radiation) which is near the surface because that wavelength is nearly smack-dab in the middle of the ~8-14 µm Infrared Atmospheric Window?
It is at that time that the climate kooks tend to run away… especially so if you concatenate that 2002/09-2020/03 surface skin temperature decrease with the 0.76 K temperature decrease over the past 16 months… showing that since 2002, the planet has cooled by ~1.37 K. LOL
So let’s do the calculations from 0.00001 µm out to 10,000 µm.
A 0.56 W m-2 dec-1 decrease at 0.93643 emissivity (ref: NASA ISCCP program), 287.64 K starting temperature, and calculating for 0.00001 to 10000 µm equates to a decrease in surface temperature from 2002/09-2020/03 of 0.3486 K / decade.
2002/09-2020/03 is 1.75 decades. 0.3486 * 1.75 = 0.61005 K temperature decrease from 2002/09-2020/03.
Now, combine that with the 0.76 K decrease in temperature over the past 16 months (which has erased all the warming seen since 1950 and nearly half the warming seen since 1901), and you can see that since 2002/09, the planet has cooled by ~1.37005 K.
And that shows that the cooling is still accelerating as the sun continues in its quiescent phase (which is expected to last until ~2053). The warming was due to a long series of now-ended solar cycles (the Modern Grand Maximum). The current quiescent phase is expected to rival the Dalton Minimum, and may rival the Maunder Minimum.
And we all stand back and enjoy the show as climate kook heads explode. LOL
NASA, GISS are the people who suddenly switched their base period “benchmark” temperature from their 1951-1980 value of 59°F to 57.02°F. For years GISS reported their anomalies with respect to 59°F, 15°C. That’s fudging the numbers.
New York Times 1995
http://www.nytimes.com/1996/01/04/world/95-is-hottest-year-on-record-as-the-global-trend-resumes.html
There is no science that supports the theory that the earth cannot get rid of extra heat.
The claim has been made that green house gases cause global warming. They support the claim by taking avg. temp. readings both surface or remote means. If they had an honest desire to look into the workings of green house gas, they would have run temp. recordings, starting after sun down and ending at sun up. It would not have cost much money, but it would expose the fraud.