


A story by Oregon Public Broadcasting (OPB) claims climate change is causing an increase various extreme weather events.
This is false. Data from the United Nations Intergovernmental Panel on Climate Change (IPCC) and the U.S. National Oceanic and Atmospheric Administration (NOAA) demonstrate weather extremes have remained relatively stable or even declined across the United States, including the Northwest, over the past century as the earth has modestly warmed.
OPB’s article titled, “Cascadia mapping shows communities most vulnerable to effects of climate change,” says climate change is causing an increase in the number and severity of floods, heatwaves, and wildfires, threatening communities across Oregon and Washington state.
“Residents of 152 cities and towns in the Pacific Northwest are particularly vulnerable to climate-fueled wildfires. Residents of 60 other communities are most susceptible to floods. And people living in 75 towns are most liable to suffer — maybe even die — because of heat waves,” writes OPB, citing a study by the liberal non-profit media group, Investigate West, to support its claims. Real-world data refutes these claims.
Drought is a critical component of most wildfires. The United States, including the Northwestern United States, has not been experiencing more frequent or severe drought in recent years. As reported in Climate at a Glance: Drought, the IPCC reports with “high confidence” that precipitation has increased over mid-latitude land areas of the Northern Hemisphere (including the United States) during the past 70 years. IPCC also has “low confidence” about any negative precipitation trends occurring globally.
Moreover, the NOAA reports America is currently is undergoing its longest period in recorded history with less than 40 percent of the country experiencing “very dry” conditions. Also, the United States in 2017 – and then again in 2019 – registered its smallest percentage of land area experiencing drought.
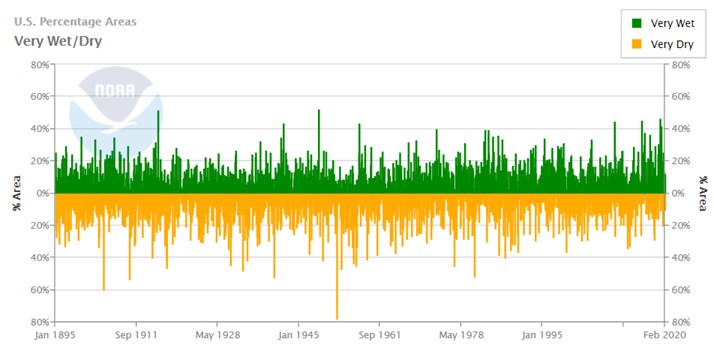
Figure 1: Percentage of United States experiencing “very wet” (in green) and “very dry” (in yellow) conditions. Source: National Oceanic and Atmospheric Administration: https://www.ncdc.noaa.gov/temp-and-precip/uspa/wet-dry/0.
Because drought is the primary climate component that would affect wildfires, it is not surprising to find real-world data show the number of wildfires and acres burned have declined over the past 70 years.
As reported in Climate at a Glance: Wildfires, long-term data from the U.S. National Interagency Fire Center (NIFC) show wildfires have dramatically declined in number and severity in recent decades. Reporting data on U.S. wildfires from as far back as 1926, NIFC documents that the number of acres annually burned recently is only1/4th to 1/5th of the annual acres burned in the 1930s.
Data on flooding is equally clear and not at all alarming. As documented in Climate at a Glance: Floods, the IPCC reports “low confidence” that climate change has had any impact on floods. IPCC even acknowledges that climate change is as likely to have reduced flooding frequency and severity as it has been to make floods more common.
As discussed in Climate Realism articles, here, here, and here, for example, to the extent costs associated with flooding have increased it is due to human alterations to the natural courses of rivers and streams – as well as people building more, more expensive, infrastructure in natural floodplains – which can increase flooding events for reasons wholly unrelated to climate change.
Nor, as claimed by OPB and Investigate West, have heatwaves become more frequent or severe in recent years. A recent summary of heatwave records, Climate at a Glance: U.S. Heatwaves, cites data from NOAA demonstrating heatwaves are far less severe in recent decades than was the case during the 1930s – nearly 100 years of global warming ago (See figure 1 below). Also, data show the majority of each state’s all-time high temperature records were set during the first half of the 20th century. And, the most accurate nationwide temperature station network, implemented in 2005, shows no sustained increase in daily high temperatures in the United States since at least 2005.
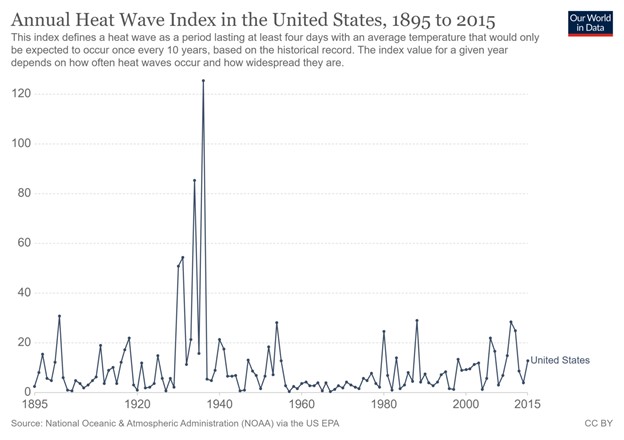
Figure 2, Heatwave Index for the contiguous United States, 1895-2015 (no later data is available). The U.S. Annual Heat Wave Index tracks the occurrence of heat wave conditions across the United States. This index defines a heat wave as a period lasting at least four days with an average temperature that would only be expected to occur once every 10 years, based on the historical record. The index value for a given year depends on how often heat waves occur and how widespread they are. Source: Our World in Data, using data from NOAA.
OPB should follow the science when it reports on climate change and extreme weather, rather than parroting alarmist fiction peddled by a liberal activist “news” organization.
Science provides clear evidence, extreme weather in the United States has declined during the past century. Communities in Oregon and Washington state should take comfort in this fact.


What is driving media to make unsubstantiated claims? Is it to have headlines that attract? Every time someone investigates these unfounded assertions, it turns out to be lies. I don’t believe in conspiracies, but I wonder what motivates these journalists.