A May 30, 2023 article by Hannah Kanik, writing for the Bay Area News Group (BANG), titled “Can California’s coastline be saved? Study shows up to 70% could be wiped out by 2100,” was circulated in dozens of newspapers served by the news outlet. Kanik’s claim that California’s coastlines could disappear isn’t just misleading, it’s absurd. It is based on flawed climate model projections, and ignores causes for erosion unrelated to climate change. Real world data indicates the actual cause of the erosion discussed in the article are the tides and weather.
Kanik’s story is based on a study issued by the U.S. Geological Survey (USGS), which “…found from 25% to 70% of California’s beaches could erode by 2100 due to rising sea levels caused by global temperature increases and greenhouse gas emissions.”
Kanik writes:
The U.S. States Geological Survey used two decades worth of satellite imagery of Ocean Beach in San Francisco — combined with models of sea levels rising from 1.6 to 10 feet due to global temperature increases — to estimate how the entire state’s coastline will shift in the next century.
That range is expected to vary based on the rate and reduction of carbon emissions over time.
While it may seem like that reality is in the distant future, the West Coast could see its sea levels rise up to eight inches in the next 25 years, according to the National Oceanic and Atmospheric Administration.
This claim is based on computer climate models predicting sea level rise (SLR), rather than looking at the trend of actual sea level observations. As Climate Realism has discussed repeatedly, climate models are seriously flawed. The most extreme projections of computer models simulations, RCP 8.5, those most likely used generate the highest SLR warned of, 10 feet by 2100, are not just exceedingly unlikely, they are likely impossible.
The article cites several locations along the California coast that are at greatest risk, including Humboldt Bay, Point Arena, Ocean Beach in San Francisco, Santa Cruz, Morro Bay, Pismo Beach, Newport Beach, and San Clemente.
Fortunately, real-world data exists in the form of tide-gauges on the U.S. West Coast. The sea level rise data is publicly available from the National Oceanic and Atmospheric Administration (NOAA) website known as Tides and Currents. Below in Figure 1, is a screen capture of that website showing tide gauges on the U.S. West Coast:
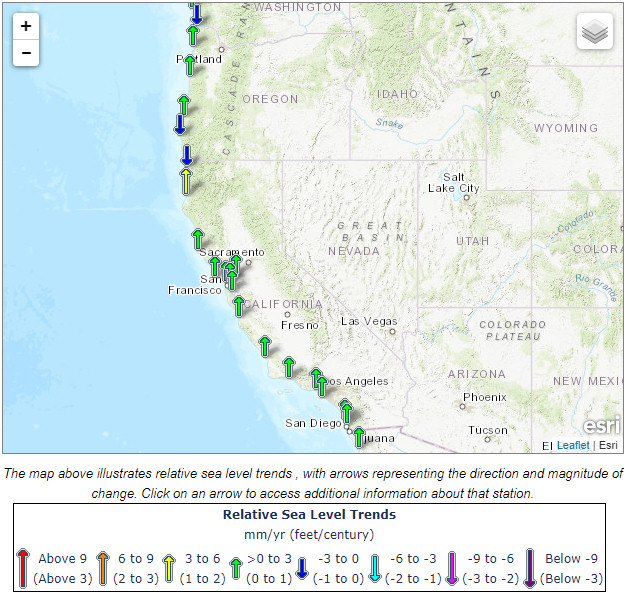
Of note in Figure 1, are two locations showing down arrows in blue, Port Orford, OR, and Crescent City, CA indicating sea level is falling, rather than rising, while just a few miles down the coast at North Spit, CA a yellow arrow indicates sea level is rising quickly. Clearly, geography, rather than climate change is at play here, because if “global warming” was indeed affecting sea level rise globally, it would do so in a consistent way. Humboldt Bay, one of the locations cited in the article as being “at risk” is next to the North Spit tide gauge that shows a strong SLR value of 4.84 millimeters/year.
However, that gauge is showing a false trend, because a 2017 peer-reviewed study Tectonic land level changes and their contribution to sea-level rise, Humboldt Bay region, Northern California from Cal-Poly Humboldt showed conclusively that “Land subsidence in and around Humboldt Bay, California contributes to sea-level rise up to 2-3 times greater than anywhere else in California.“
In other words, the land is sinking, rather than the sea rising. Thus, climate-driven SLR is not a factor there.
Going north to south, the next supposedly at-risk location is Point Arena, CA. As seen in Figure 2, the nearby Arena Cove tide gauge shows a mere 0.86 millimeters/year SLR from 1972 to present.
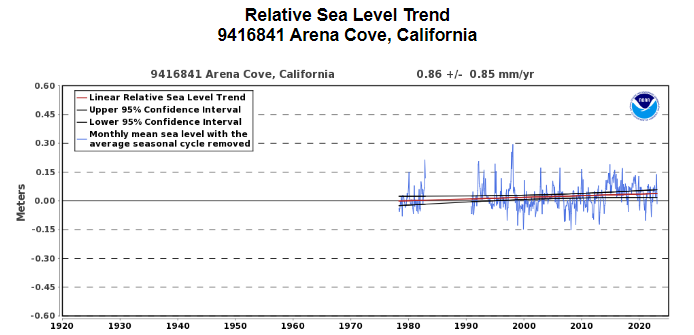
At that rate, for Point Arena to reach the lowest SLR value of 1.6 feet (488mm) claimed in the article, using simple math (488 mm ÷ 0.86mm/year) it would take 567.4 years to reach that height. That’s hardly concerning, and well outside the claimed 77 years (by year 2100) claimed in the article headline.
The remainder of the “at-risk” locations have been compiled into the table below, showing the nearest NOAA tide gauge rate of SLR, and the number of years it would take to reach the lowest value of 1.6 ft of SLR cited in the article.
| “At-risk” location in the article | Nearest NOAA tide gauge | Rate of SLR at NOAA tide gauge | Number of years for SLR to reach 1.6ft |
| Ocean Beach in SFO | San Francisco | 1.96 mm/year | 249 years |
| Santa Cruz | Monterey | 1.62 mm/year | 301 years |
| Morro Bay | Port San Luis | 0.96 mm/year | 508 years |
| Pismo Beach | Santa Barbara | 0.99 mm/year | 493 years |
| Newport Beach | Los Angeles | 1.04 mm/year | 469 years |
| San Clemente | La Jolla | 2.03 mm/year | 240 years |
Clearly, based on real-world SLR data rather than model projections, even the lowest amount of SLR predicted by the models is at the minimum, 240 years away. For the highest projected SLR, 10 feet (3048mm) the number ranges from 1500 years at San Clemente to 3175 years at Morro Bay.
A 10 foot rise of SLR by 2100 is an absurd prediction, and can’t possibly come true.
The alarming rate of sea level rise in computer models is predicated on the belief that sea level rise is accelerating rather than being slow and steady as we see in the actual tide gauge data. This comes from satellite data.
Sea-level data reported from recently launched satellites indicate seas are rising approximately of 3.4 mm/year, but as explored in “Acceleration” in Sea-Level Rise Found to Be False – An artifact of Switching Satellites at Climate Realism, the increase in the rate of rise is artificial, and artifact of switching satellite sets and bad math. By contrast, NOAA’s tidal gauge stations have recorded a rise of approximately 1 to 2 mm annually, a rate which is little changed over the century or so for which we have adequate records. But there’s a rub – only a few decades of satellite data exist. By contrast, tide gauge records like New York City go back more than 100 years, and show no evidence of acceleration.
Once you look at real-world data from tide gauges and see how long it would take for the claimed SLR to occur, it becomes evident that the BANG article’s claims have no merit whatsoever.
Further, it should be noted that in the article itself, all of the damaged sections of coastlines were attributed to individual storm events, rather than long-term climate change. Climate at a Glance: Weather vs. Climate notes that in Chapter 11 of the most recent International Panel on Climate Change (IPCC) AR6 report, Weather and Climate Extreme Events in a Changing Climate, the IPCC concludes that altered trends in severe weather events from climate change cannot be detected. The IPCC finds severe weather events are not increasing or becoming more intense. Nor can any changes to severe weather events be attributed to human or natural climate change.
Storms are not getting worse due to climate change. Also, most coastal damages are caused by storms, and the rate of SLR has not increased dramatically in recent years. As a result, one can conclude that any threat to coastal properties in California is due to building on unstable ground on a coast that is prone to natural erosion due to the daily tides, perfectly natural periodic extreme weather events, and land compaction and subsidence, not climate change.
Sadly, many people will be misled by BANG’s “reporting,” which chose to stoke climate alarm rather than discussing the factors which actually pose threats to California’s coastal properties.